Figures & data
Figure 1. Display of example consistent and inconsistent responses.
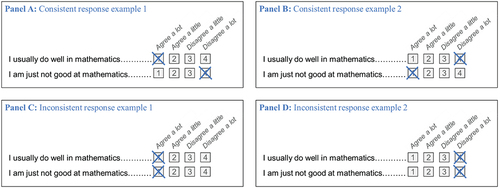
Table 1. Mixed-worded mathematics self-concept scale administered in TIMSS 2019 Grades 4 and 8.
Figure 2. Prevalence of inconsistent respondents in Grades 4 and 8.
Figure 3. Results of regressing inconsistent responding variable on mathematics achievement, student age, language at home, and gender in grades 4 and 8.
Figure 4. Results of regressing shares of inconsistent respondents on mean mathematics achievement in Grades 4 and 8.
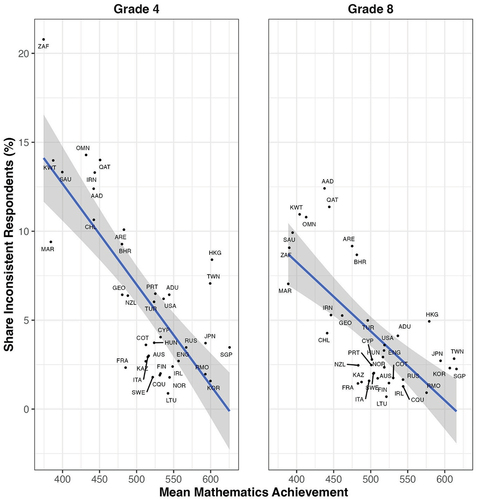
Figure 5. Results of regressing shares of inconsistent respondents on share of students who (almost) always speak test language at home in Grades 4 and 8.
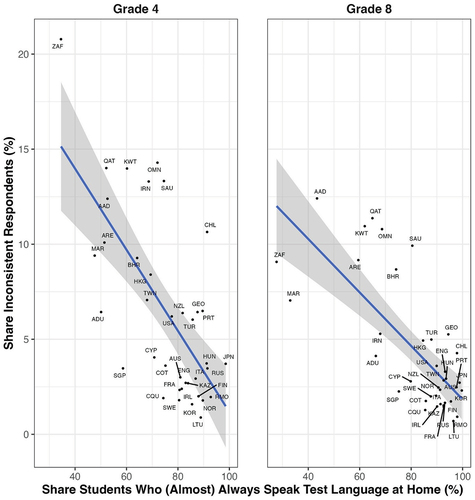
Figure A1. Results of regressing inconsistent responding variable on mathematics achievement in Grades 4 and 8.
Figure A2. Results of regressing inconsistent responding variable on student age in Grades 4 and 8.
Figure A3. Results of regressing inconsistent responding variable on language at home in Grades 4 and 8.
Figure A4. Results of regressing inconsistent responding variable on gender in Grades 4 and 8.