Figures & data
Figure 1. The role of modelling in the interpretation and use of observation scores.
Table 1. Classification of models discussed in this paper.
Figure 2. A basic unidimensional factor model for the CLASS domain of instructional support represented in a classic representation and a Venn diagram.
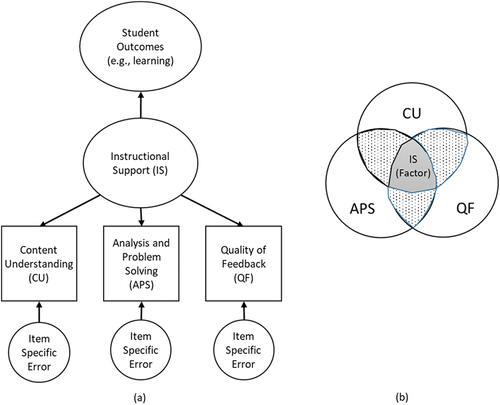
Figure 3. Hypothetical teacher classes with linear mean patterns across items.
Figure 4. Hypothetical teacher classes with overlapping mean patterns across items.
Figure 5. Formative measurement model for instructional support using a path model representation (left) and a Venn diagram (right).
Figure 6. Reflective-formative measurement model for instructional support.
Note. Path model representation on left contains three items of Instructional Support as reflective variables and Instructional Support as a formative variable. Venn diagram right shows how overlap of observations across eaters is used to model latent items, and how these capture the formative variable Instructional Support.