Figures & data
Table 1. Sequence of the primers used in real-time quantitative RT-PCR.
Figure 1. Real-time RT-PCR analyses of pro-inflammatory, inflammatory, and anti-inflammatory genes of hybrid commercial chickens under quercetin supplementation or PBS. Bar graphs show relative mRNA expressions of study genes. The data are represented as mean ± SE (n = 4–7 pools), *p < .05, **p < .01, ***p < .001 by unpaired Student t test.
Figure 2. Gene expressions in heterophils of Thai indigenous chicken breed (Pradu Hang Dam) under the effects of quercetin or PBS by real-time RT-PCR analyses. Bar graphs show relative mRNA expressions of study genes. The data are represented as mean ± SE (n = 8 pools), *p < .05, **p < .01, ***p < .001, ****p < .0001 by unpaired Student t test.
Figure 3. Venn diagram summarizes similarities and differences among up-regulated or down-regulated of gene expressions in heterophils supplemented with quercetin. As depicted, hybrid chickens are very different from Pradu chickens.
Figure 4. The heat map depicts a mean expression level of each studied gene in chicken heterophils from hybrid broilers (A) and from Pradu chickens (B) with either PBS or quercetin treatment. The expression values ranged from −3 to +3. Red indicates up-regulation, green indicates down-regulation, and black indicates no change in gene expression. The expression levels are according to the colour scale of the log2 values.
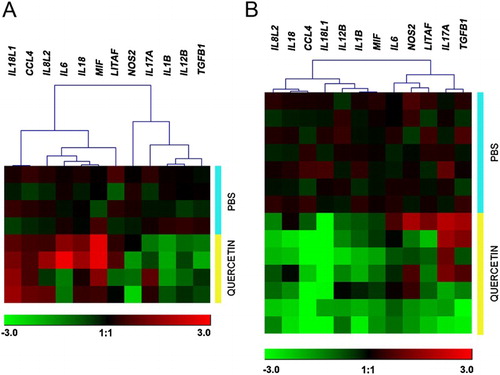
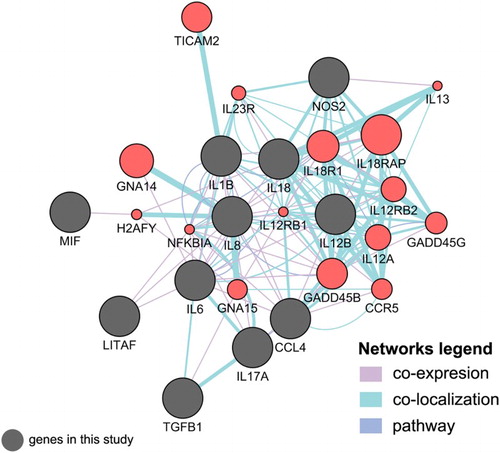
Figure 5. CytoScape and GeneMANIA interaction network of known genes with co-expression, co-localization, and pathway. Dim grey nodes represent query gene lists. Salmon red nodes represent connecting genes involved in the inflammatory response to bacterial LPS pathway and cytokine activity.