Figures & data
Table 1 Primers used in this study
Figure 1 Nucleotide sequence analysis of PmOXT. (A) shows nucleotide sequence and deduced amino acids of PmOXT. 5′- and 3′-UTR are indicated by small letters. ORF and deduced amino acid (aa) sequences are indicated by capital letters. Nucleotides with borders correspond to the initiation codon (ATG) and stop codon (TGA). Sequence in yellow background represents the xylosetransferase domain. The aa in grey signifies branch domain. The underlined aa represents the WSC domain.
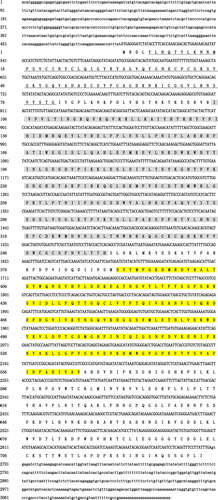
Figure 2 Multiple-sequence alignment of PmOXT aa sequences. Dark blue background indicates conserved aa; pink background indicates aa with strong similarity; light blue indicates aa with weak similarity; the right numbers show position of sequence alignment aa. Bracket presents DXD motif. The accession numbers of the sequences used in this alignment are as follows: Crassostrea gigas (EKC32292.1), Aplysia californica (XP_012944960.1), Mizuhopecten yessoensis (OWF50901.1), and Lingula anatina (XP_013390783.1).
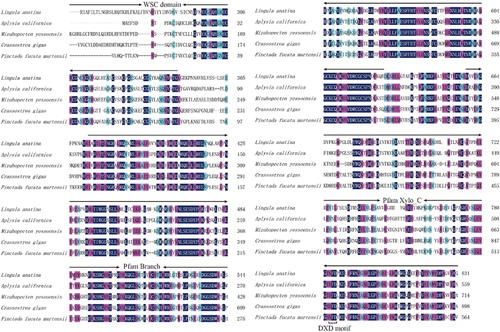
Figure 3 Predicted structural organization of XYLT among different species. Accession number for sequences used in this alignment are: Crassostrea gigas (EKC32292.1), A. californica (XP_012944960.1), L. anatina (XP_013390783.1), Homo sapiens (NP_071449.1 and NP_071450.2), and Mus musculus (NP_783576.2 and NP_665827.2).
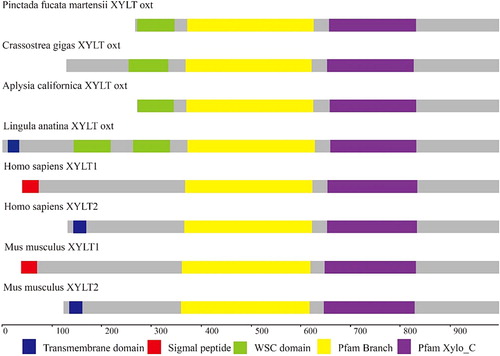
Figure 4 Ribbon representation of structures of PmOXT and OXT from C. gigas (EKC32292.1). (A) and (B) show the protein sequence of PmOXT and OXT of C. gigas, respectively. (C) and (D) represent the xylosyltransferase domain of PmOXT and OXT of C. gigas, respectively. WSC domain, branch domain, and xylosyltransferase domain are shown in green, yellow, and purple, respectively. DXD motif is represented in red. The C and N in the figures show the C- and N-terminal of sequences, respectively.
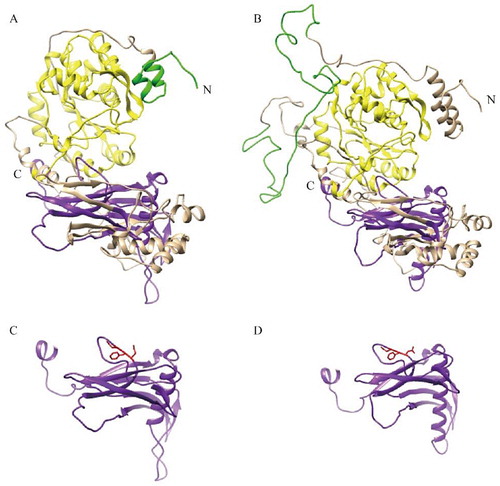
Figure 5 Phylogenetic tree of XYLT among different species. The phylogenetic tree is constructed using MEGA software 6.05 by the NJ method and 1000 replications of bootstrap. The scale bar indicates a branch length of 0.1. The XYLT protein sequences used for phylogenetic analysis include the following: Crassostrea gigas (EKC32292.1), A. californica (XP_012944960.1), L. anatina (XP_013390783.1), Homo sapiens (NP_071449.1 and NP_071450.2) and Mus musculus (NP_783576.2 and NP_665827.2), Danio rerio (NP_001165868.1 and NP_001124250.1), Gallus gallus (AAT44331.1 and NP_001001785.1), Lonchura striata domestica (OWK61928.1 and XP_021410469.1), Cimex lectularius (XP_014257441.1), Drosophila willistoni (XP_002067754.1), Bactrocera latifrons (JAI44494.1), Blattella germanica (PSN41238.1), and Drosophila erecta (XP_001971258.1).
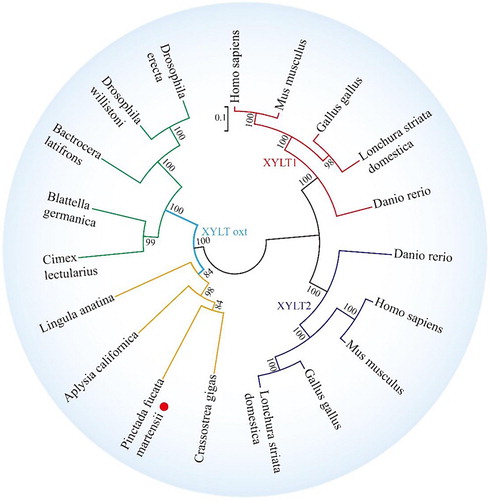
Figure 6 Expression pattern of PmOXT in P. f. martensii. (A) Expression pattern of PmOXT in different tissues. (B) Expression pattern of PmOXT in developmental stages. Notes: ME: Marginal zone of mantle, MC: Central zone of mantle, A: Adductor muscle, HE: Hepatopancreas, GI: Gill, B: Haemocyte, Fe: fertilized egg, B: blastula, G: gastrula, T: trochophore, D: D-stage larvae, EU: early umbo larvae, EL: eyed larvae, and S: spat. Mean values with different letters are significantly different as determined through one-way ANOVA. The vertical bar represents standard deviation (P < 0.05).
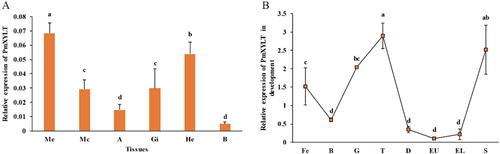
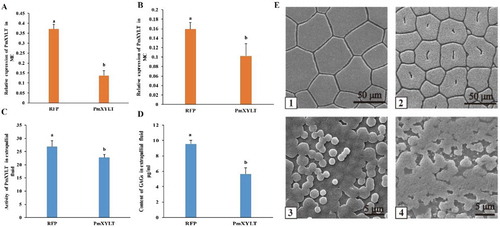
Figure 7 Influence of RNA interference on PmOXT and shell formation. (A) and (B) show PmOXT expression in ME and MC, respectively. (C) and (D) show the enzyme activity of OXT and content of GAGs in the extrapallial fluid after RNAi, respectively. Mean values with different letters are significantly different as determined through T-test. The vertical bar represents standard deviation (P < 0.05). (E) shows the microstructure of shells after RNAi. (E)-1 and (E)-2 show shell prismatic layer of dsRNA-RFP and dsRNA-PmOXT group after RNAi, respectively. (E)-3 and (E)-4 present shell nacre of dsRNA-RFP and dsRNA-PmOXT group after RNAi, respectively. Bars represent 50 and 5 µm scale in images of (E)-1, 2 and (E)-3, 4, respectively.