Figures & data
Table 1. Composition and analysed nutrient content of experimental diets on dry matter basis (%).
Figure 1. Values of dry matter intake (a), dry matter intake in relation to body weight (b) and ruminal pH (c) and from cattle with or without adaptation to highly fermentable carbohydrate diets. The arrows indicate the change of diets in the adapted group. The asterisks indicate significant difference in the respective day of experiment.
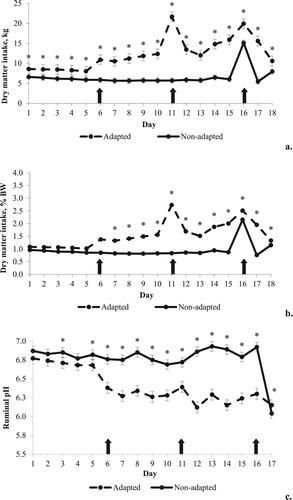
Table 2. Values of dry matter digestibility and its fractions in cattle adapted or not to highly fermentable carbohydrates diets.
Table 3. Values of ruminal fermentation variables in cattle adapted or not to highly fermentable carbohydrates diets.
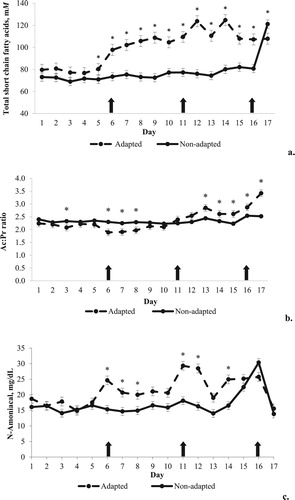
Figure 2. Values of total concentration of short-chain fatty acids (a), acetate:propionate ratio (b) and ammonia nitrogen concentration (c) from cattle with or without adaptation to highly fermentable carbohydrates diets. The arrows indicate the change of diets in the adapted group. The asterisks indicate significant difference in the respective day of experiment.