
Figures & data
Table 1. Primers used for real time PCR.
Table 2. Details of the antibodies used for western blots.
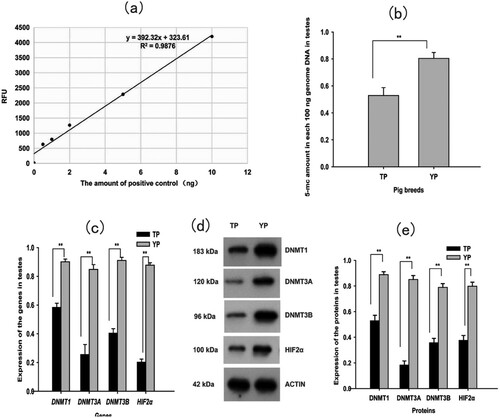
Figure 1. (a) The standard curve for quantifying genomic DNA methylation. (b) Genomic DNA methylation levels in testes. (c) Expression of DNA methyltransferases (DNMT1, DNMT3A, DNMT3B) and hypoxia-inducible factor 2α (HIF2α) mRNA in testes. (d) Western blot (WB) analysis of the four proteins (DNMT1, DNMT3A, DNMT3B and HIF2 α). ACTIN was used as a loading control. (e) Statistical results of WB for the four proteins in testes. Each bar represents mean ± standard error (S.E.), * Significant difference (P < 0.05), ** Extreme significant difference (P < 0.01). TP = Tibetan pig (n = 10); YP = Yorkshire pig (n = 10).
Supplemental material