
Figures & data
Table 1. Composition, calculated nutrient, and analysed fatty acid content of the control and the experimental diets.
Table 2. Fatty acid composition of the control and the experimental sows’ milk.
Table 3. The chemical composition of the control and the experimental milk samples.
Figure 1. PCA score plot of milk samples based on the odour profiles described by all sensors, indicating the four groups of samples (CON1: control, 1st sampling, green diamond; CON2: control, 2nd sampling, pink star; EXP1: experimental, 1st sampling, blue square; EXP2: experimental, 2nd sampling, red triangle).
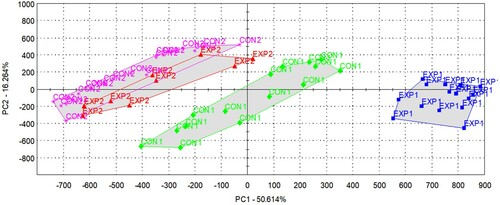
Figure 2. LDA results for the discrimination of the control (CON, blue square) and experimental (EXP, red triangle) milk samples based on the odour profiles described by all sensors.
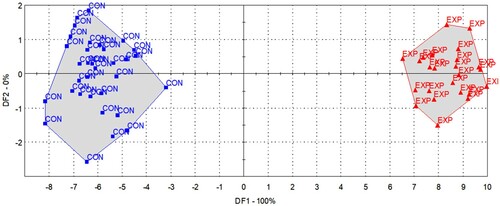
Figure 3. Spider plot of the electronic nose (EN) data of the control (blue) and experimental (red) milk samples on the plane defined by the five selected sensors, indicating the names of the sensors (retention index and column type) on the angle, and intensity values (area under the chromatogram peak at the respective retention index) along the radius.
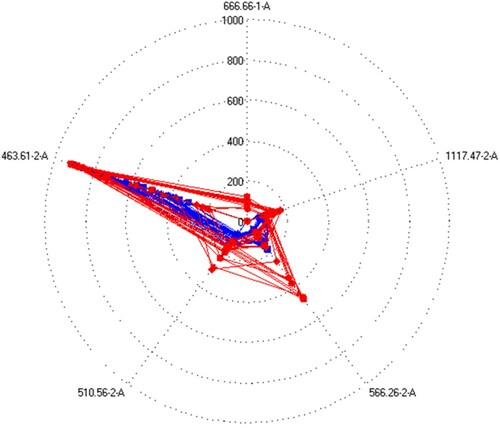
Figure 4. Bi-plots showing the loading vectors and the score plots of milk samples (CON1: control, 1st sampling, blue square; CON2: control, 2nd sampling, red triangle; EXP1: experimental, 1st sampling, green diamond; EXP2: experimental, 2nd sampling, pink star) in the plane of (a) PC1-PC2 and (b) PC2-PC3 when the PCA was performed with data from five selected sensors.
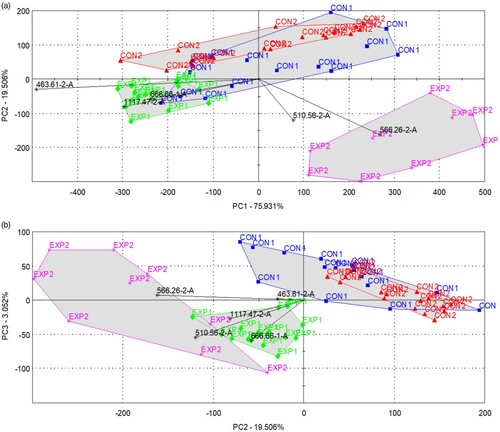
Figure 5. Bi-plot showing the LDA results for the discrimination of the control (CON, blue square) and experimental (EXP, red triangle) milk samples based on the odour profiles described by five selected sensors, and the loading vectors representing the dominance of the sensors.
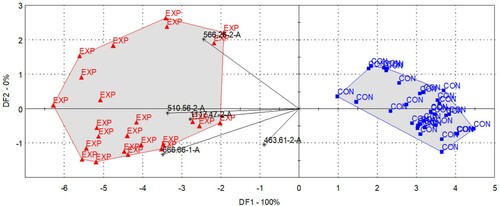
Table 4. Assignment of the retention indices corresponding to the five selected sensors.
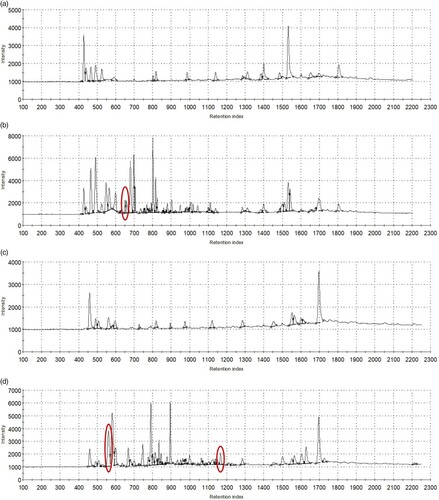
Figure 6. The chromatograms of sunflower oil (a,c) and fish oil (b,d) recorded using GC columns MXT-5 (a,b) and MXT-1701 (c,d), with the indications (red circles) of peaks specific for fish oil appearing in EXP milk samples (retention index 666 on column 1-A, 566 and 1117 on column 2-A, refer to for assignment).
Data availability statement
The data presented in this study are available upon request from the corresponding author.