
Figures & data
Table 1. Chemical composition, dissolvable nitrogen, tocopherol content (mg/kg DM), total FA content (g/kg DM) and FA composition (g FA/kg FA) of raw and micronized rapeseeds.
Figure 1. Effect of micronization and vitamin E on crude fat disappearance. Whole flaked raw rapeseed without vitamin E (RR0), micronized whole flaked rapeseed without vitamin E (MR0), whole flaked raw rapeseed supplemented with 200 mg/kg DM vitamin E (RR200), micronized whole flaked rapeseed supplemented with 200 mg/kg DM vitamin E (MR200). Error bars represent the standard error of the mean. The interaction between micronization and incubation time and the interaction between vitamin E and incubation time were not significant.
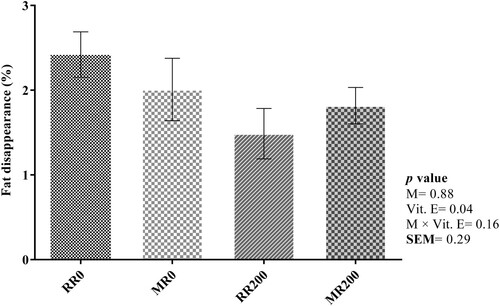
Figure 2. Changes in linoleic acid (a), α-linolenic acid (b) and stearic acid (c) concentration during incubation. Presented valuse are Ls-means for whole flaked raw rapeseed (RR) and micronized whole flaked rapeseed (MR). Error bars represent the standard error of mean.
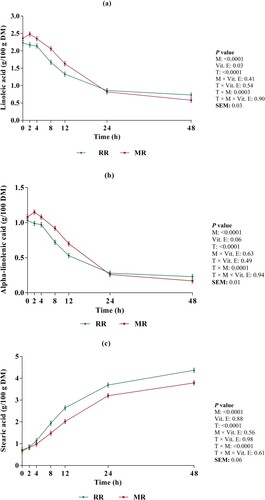
Table 2. Effects of micronization and vitamin E on FA biohydrogenation(g/100 g DM).
Figure 3. Changes in cis-9, trans-11 CLA (a), C18:1 trans-11 (b) and C18:1 trans-10 (c) concentration during incubation. Presented valuse are Ls-means for whole flaked raw rapeseed (RR) and micronized whole flaked rapeseed (MR). Error bars represent the standard error of mean.
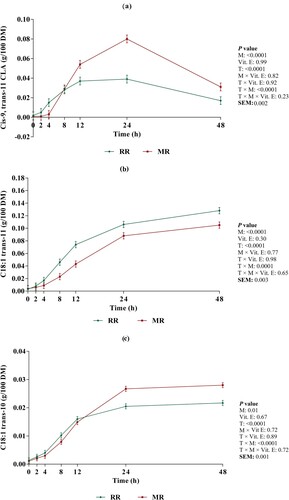
Table 3. Effect of micronization and vitamin E on biohydrogenation rate (%/h) and lag time (h) of LA, LnA, OA, SA and VA.