
Figures & data
Table 1. Mean haptoglobin concentrations (ng/ml) in serum samples from dairy cows in Galicia (NW Spain) according to calving number and lactation phase.
Table 2. Results of mixed-effects model for the effect of lactation number and lactation phase on mean haptoglobin concentrations (ng/ml) in serum samples from dairy cows in Galicia (NW Spain).
Figure 1. Scatter plot of serum haptoglobin concentration (y-axis) and milk haptoglobin concentration (x-axis) (ng/ml), in 80 dairy cows from Galicia (NW Spain).
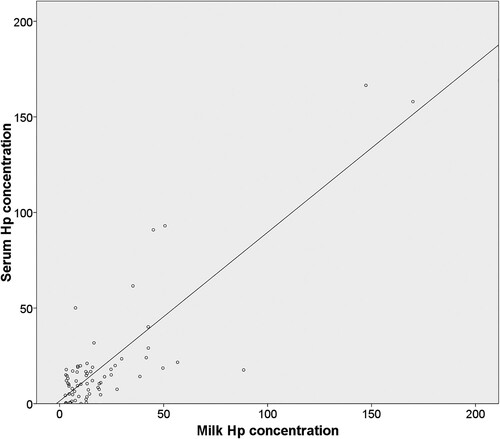
Table 3. Descriptive statistics for haptoglobin concentrations (ng/ml) by type of sample (serum/milk) from 80 dairy cows in Galicia (NW Spain).