
Figures & data
Table 1. Least squares means of body weight at birth, 3, 6, 12, 18, and 24 months of age of crossbred growing bull calves.
Table 2. Estimated growth curve parameters for body weight of Frisian Boran crossbred bull calves.
Figure 1. Estimated and observed curves of 50% FB and 75% FB crossbred Bull calves for body weight (A) and total experimental DM intake (B).
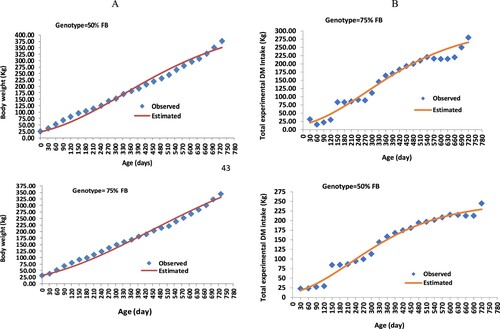
Figure 2. Estimated curves of 50% FB and 75% FB crossbred bull calves for body weight (A) and total experimental DM intake (B).
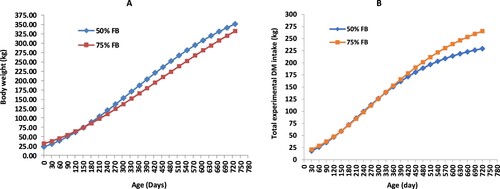
Table 3. Estimated growth curve parameters for dry matter intake of Frisian Boran crossbred bull calves.
Table 4. Correlation coefficients between growth curve parameters for body weight and dry matter intake of Frisian Boran crossbred bull calves.