
Figures & data
Figure 1. Nigeria a) Agroecological zones, major settlements, and Local Government Areas (3rd administrative level), b) Biophysical map depicting elevation, topography, major rivers and lakes.
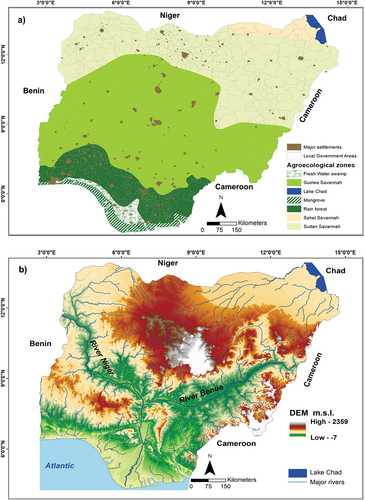
Figure 2. Workflow. a) Input data, i–ii. Preprocessing of images and multiyear composites — Surface reflectance median bands, Normalized Difference Vegetation Index (NDVI), Modified Normalized Difference Water Index (MNDWI), Normalized Difference Built-up Index (NDBI), iii. Reference datasets used for training and validation, iv. Auxiliary data for post-processing land cover maps for misclassified settlements and wetlands. b) Image classification of land cover with Random Forest classifier for 2000, 2013, 2022. c) Intensities of land cover change computed at the interval and category levels for 2000–2013, 2013–2022. d) Human-appropriated natural land cover (HANLC), i. Land cover flows between natural land cover types and human activity-related land-uses, ii. Estimates of HANLC changes by agroecological zones.
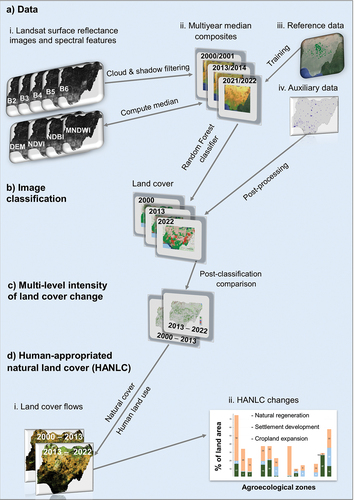
Table 1. Datasets used in this study.
Table 2. The classification scheme used in this study.
Table 3. Mathematical notation for computing annual intensities of land cover change patterns following Aldwaik and Pontius (Citation2012).
Table 4. User, producer and overall accuracy for each category.
Figure 3. Land area of each category a) Proportion of land per category (%) and the spatial distribution in ai) 2000, aii) 2013 and aiii) 2022. bi) Amount of persisting land cover and land area (km2) gained by each category from other land cover types during the first time-interval (2000–2013) and, bii) second time-interval (2013–2022). Note that actual values of persistent tree-cover are depicted on the bars. Appendix 1 provides an overview of changes by category during each time-interval.
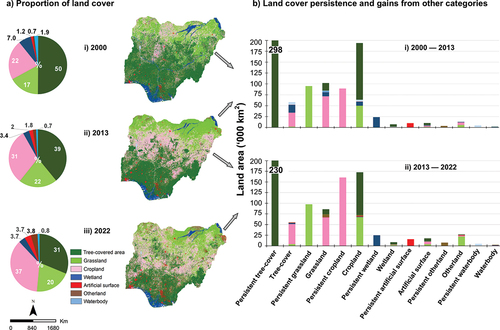
Figure 4. The change budget per land cover category during both time-intervals (2000–2013, 2013–2022). Each category’s gains, persistence and losses are shown as a percentage of the study area (+ means net gain, – means net loss).
Figure 5. Annual observed intensity of change during two time-intervals, 2000–2013, 2013–2022 (a) Annual intensity of change among land cover categories, (b) Annual intensity of change by agroecological zones.
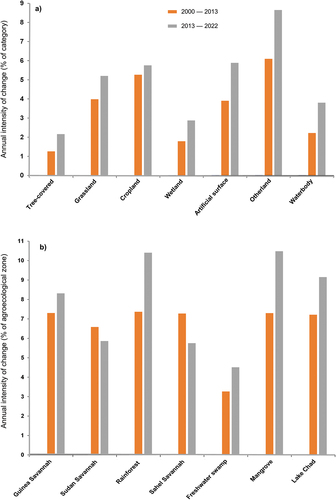
Figure 6. Persisting and major land cover transitions by agroecological zones during 2000–2013 and 2013–2022.
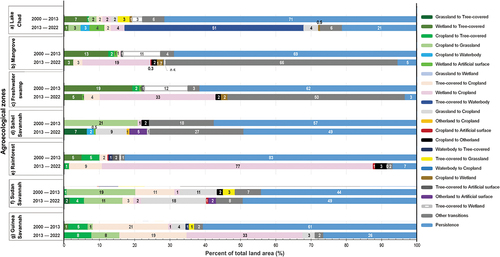
Figure 7. Major trajectories of natural and human-appropriated natural land cover (‘000 km2) during 2000–2013 and 2013–2022) in areas of (a) Cropland, (b) Settlement and infrastructure (c) Natural land cover. Using 2013–2022 as an example, actual percentages are shown in the legend to highlight how the values of the land cover transitions between the classes match. For example, 18.5% of cropland expansion into natural land cover in 2013–2022 (Fig. a–iv) is a subset of the 19.8% lost by natural cover to cropland and settlement in Fig. c–vi.
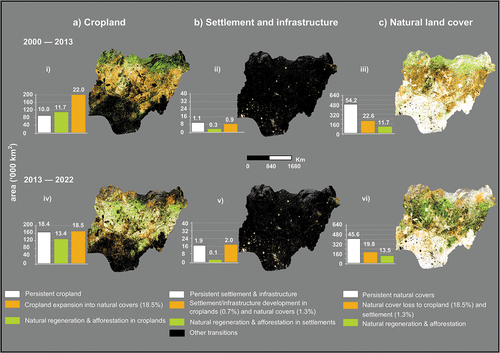
Figure 8. Extent of human-appropriated natural land cover in agroecological zones.
Table 5. HANLC changes expressed as percent of total land area in agroecological zones, where the upper number is 2000–2013 and the lower number is 2013–2022.