
Figures & data
Figure 1. US/Canadian Border-West Coast (a) current chart scheme (IC-ENC Citation2022) and (b) planned gridded scheme (NOAA Citation2023).
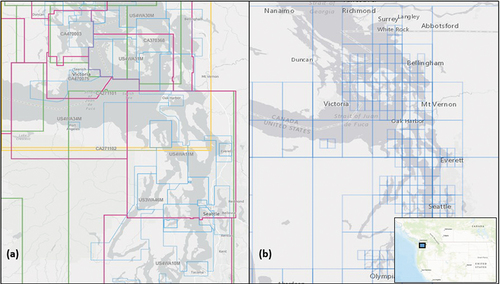
Table 1. ENC usage bands and navigational purpose and the respective IHO recommended OCS compilation scales.
Table 2. Nautical chart constraints template example.
Figure 2. An abstract schematic description of the automated nautical generalization model (Nada et al. Citation2022).
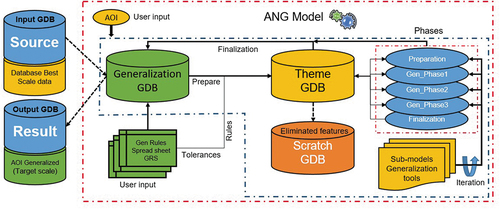
Figure 3. The generalization phases and sub-models in ArcGIS Pro.
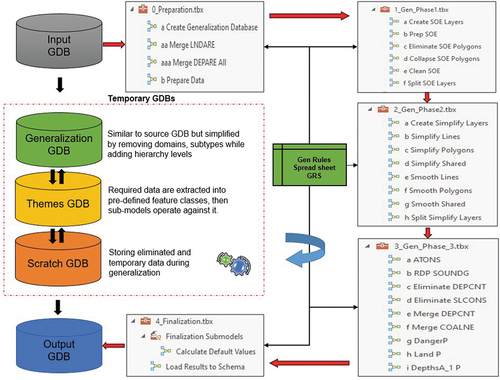
Table 3. The geometric and generalization relationship (defined in the GRS).
Figure 4. Removing overlaps between Polygons as per the GRS Hierarchy levels.
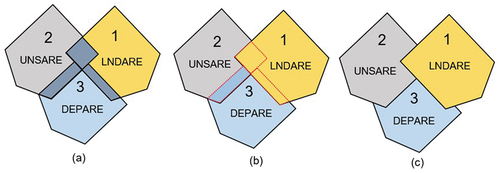
Figure 5. Filling gaps between polygons as per the GRS hierarchy levels.
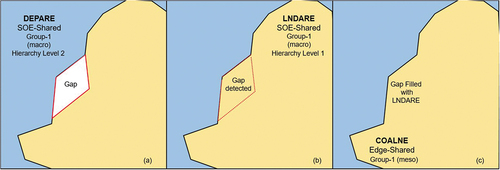
Figure 6. The simplify shared sub-model flow chart.
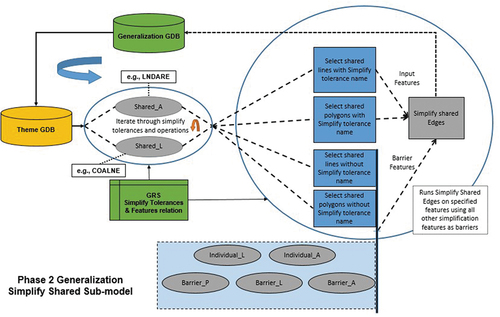
Figure 7. The generalization model – example on land area and the related features.
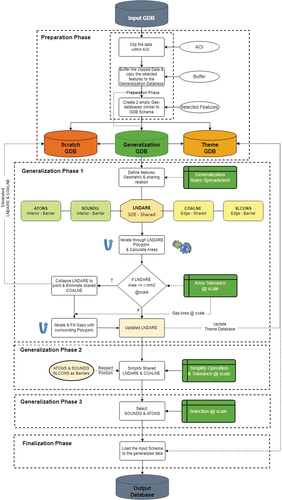
Figure 8. The study areas in NY Long Island Sound-USA and completed, in-work, and planned new cells as of March 2023 (NOAA Citation2023).
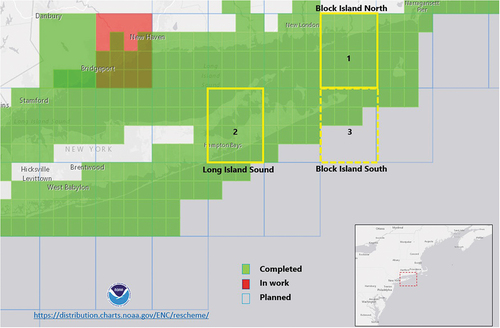
Table 4. Current NOAA ENC status as of March 2023 (NOAA Citation2023).
Table 5. ENC selected S-57/101 features and associated NIS feature classes.
Figure 9. Research case-1, Block Island North, NY-USA (a) Model input 1:20k (b) Model output 1:40k (c) Model output 1:80k.
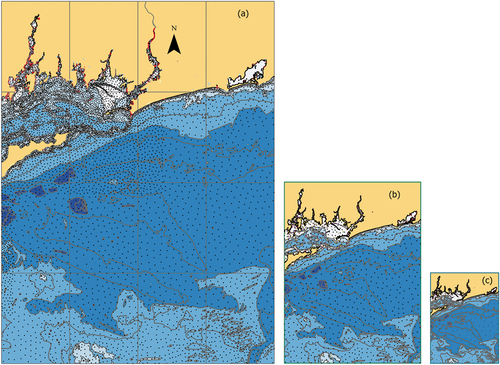
Figure 10. Result Case-2, Long Island Sound, NY-USA (a) Before generalization (b) After generalization.
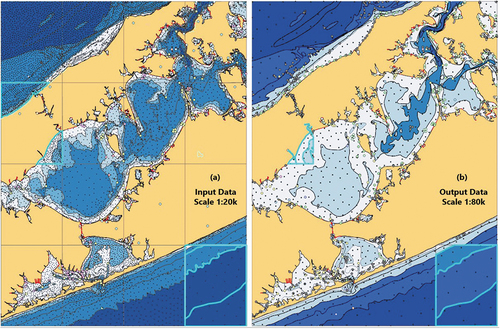
Figure 11. Result Case-3, Block Island South, NY-USA (a) Before generalization (b) After generalization.
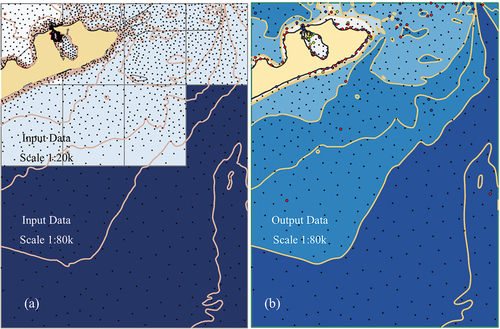
Table 6. Topology validation checks (IHO Citation2018.).
Figure 12. Safety validation tool results (a) Input database (b) Output database with generalization difference (c) Output database with Safety violations (d) Output Database.
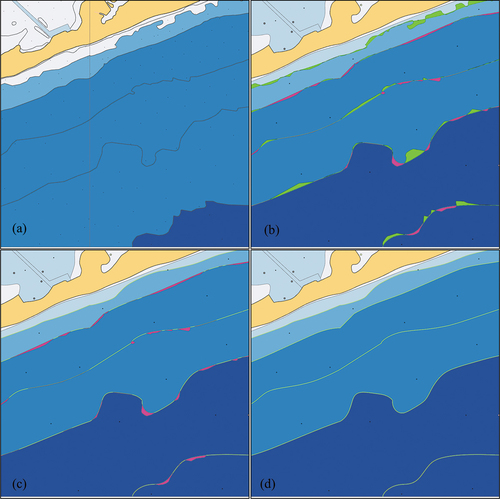
Figure A1. The Automated Generalization Model General Flow Chart.
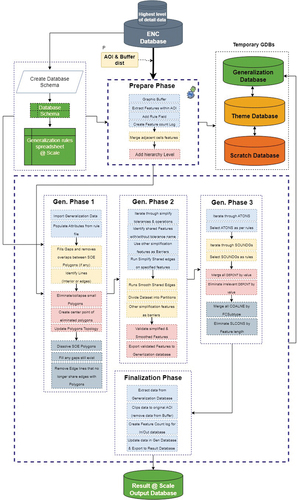
Figure A2. Research Cases (1, 2 and 3) Bar Charts for features before and after generalization.
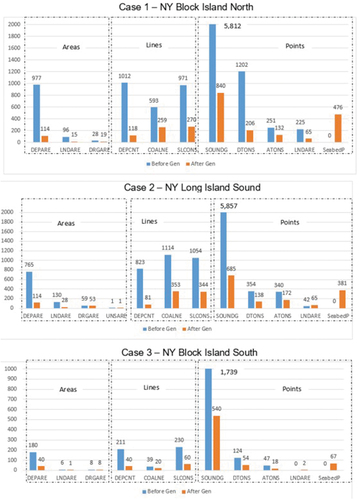
Figure A3. Topology validation tool results for the three research cases.
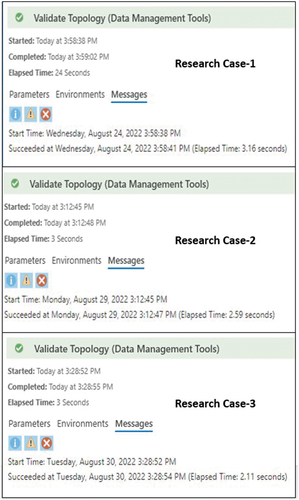
Table A1. Case-1 feature counts before and after generalization (only those in bold are used from before generalization for the calculations).
Table A2. Case-2 feature counts before and after generalization.
Table A3. Case-3 feature counts before and after generalization.
Table A4. Study area ENC (title, name, edition and scale).
Data availability statement
The data that support the findings of this study are available in figshare at:
https://figshare.com/s/7343dc119ddf6eba00f1.
These data were derived from the following resources available in the public domain: Office of Coast Survey, National Oceanic and Atmospheric Administration https://charts.noaa.gov/InteractiveCatalog/nrnc.shtml#mapTabs-2.