Figures & data
Figure 1. Overview flowchart of the combined SAR-optical burn date improvement and burn date uncertainty range reduction. It uses Sentinel-1 VH imagery difference images in conjunction with the MCD64A1 burn pixels and associated ancillary data, a maximum filter, and then a date improvement and uncertainty reduction algorithm shown on the right side.
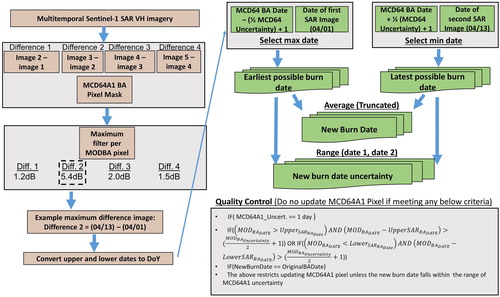
Table 1. Sentinel-1 VH SAR imagery acquired over Northern Laos and Thailand to demonstrate the algorithm for the local peak burning month of April.
Figure 2. April BA uncertainty with VH multitemporal SAR composite and burned area overlaid. Signal from burned pixels is evident.
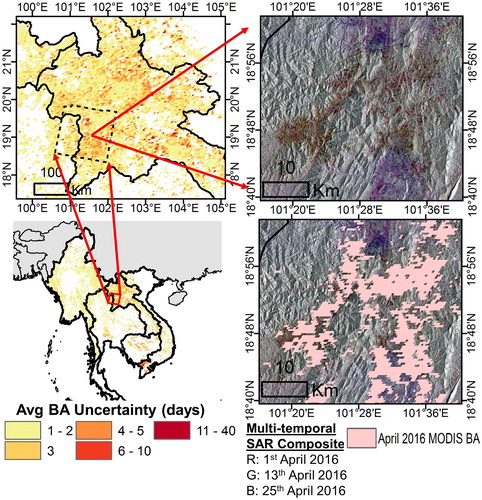
Figure 3. Example SAR-assisted burn date implementation for a MODIS Burned area Pixel during April. It demonstrates that at the lower date level the SAR data (Max Backscatter decrease detected at VH difference image for 13 April and 25 April) provides the lowest possible burn date, while at the upper date level the MCD64A1 uncertainty upper limit at 23rd April is the limiting factor. The new burn date is the average date between the upper and lower date limits. Therefore, using an effective combination of SAR and optical-based data can improve estimated burn date and reduce date uncertainty.
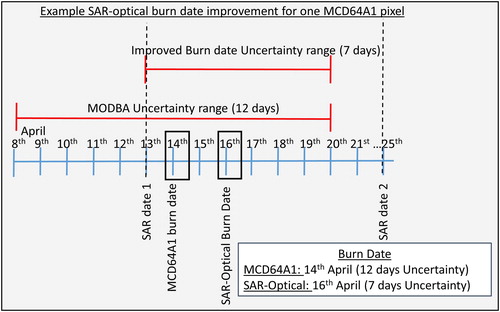
Figure 4. MCD64A1 burn date uncertainty in days for the 500 m BA product. For visualization purposes, product rescaled to approximately 5 km. Very high uncertainty can be seen in the Mekong Delta, Borneo and Sumatra, as well as Northern Laos. Uncertainty is shown for peak burning months.
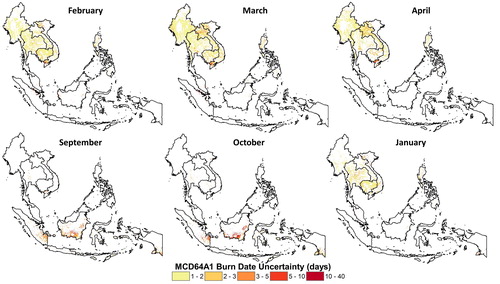
Figure 5. Country-level burn date uncertainty statistics for all Southeast Asia averaged per month (2008–2017) with (a) average uncertainty (days), (b) average standard deviation of uncertainty (days), (c) average maximum uncertainty (days) and (d) average burned area (in hectares) shown only for the study area countries.
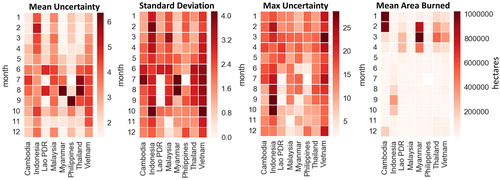
Figure 6. MODIS collection six active fires and burned areas for April 2016 overlaid on a difference image of 100 m Sentinel-1 VH gamma-nought dB backscatter (25 April – 13 April). This example area was mostly subject to burning between this date range. The high decrease in backscatter between the two dates is evident in most of the burn pixels. It also appears that some BA’s may have been missed (area circled). Imagery after the fires, shows an increase in backscatter following fire recovery and management practices.
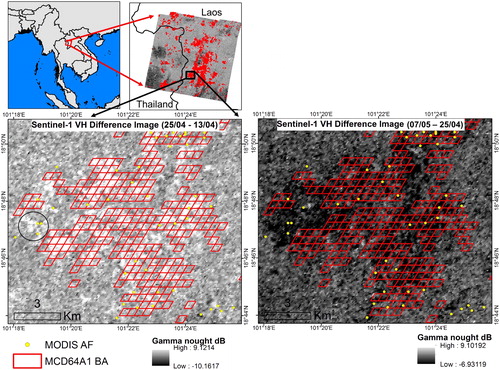
Figure 7. Distribution plot binned into 1 dB intervals showing the maximum decrease in VH backscatter within each MCD64A1 pixel.
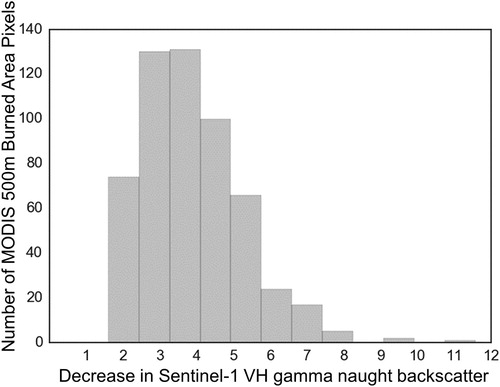
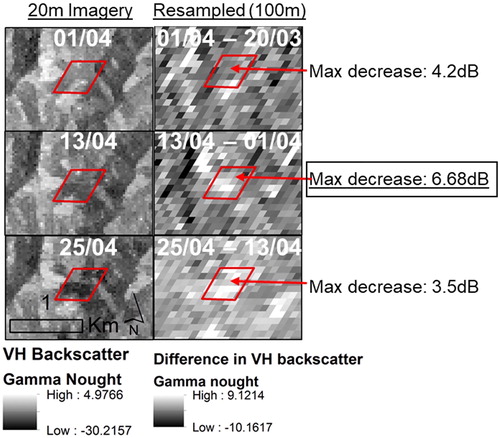
Figure 8. Illustrates the processed Sentinel-1 VH imagery on the left column over a selected MCD64A1 burn pixel for the month of April at native resolution. The right column shows the difference image (i.e. 1 April minus 20 March) for the 100 m resampled data. The maximum decrease in backscatter occurred between 1 April and 13 April, suggesting the burn date falls within this range. For quality control, the date of burn is further refined based on MODIS DoY burn and associated DoY uncertainty (in days).
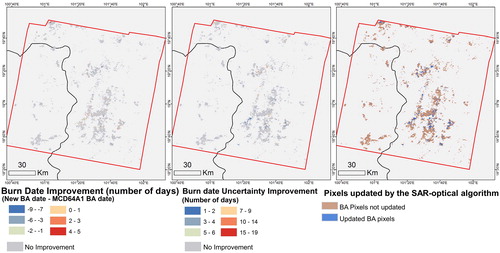
Figure 9. Spatial variation of MCD64A1 pixels which were updated by the SAR-optical algorithm for (a) improved burn dates, and (b) reduction in burn date uncertainty. Pixels were only updated if they matched the criteria described in the quality assurance algorithm.
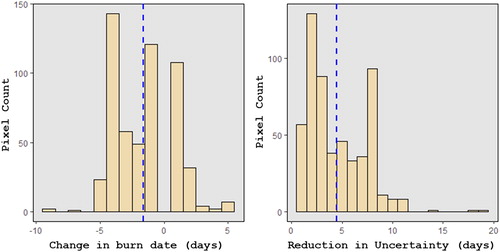
Figure 10. Pixel counts shown for the SAR-optical burned area product with: (a) change in burn date from the original MCD64A1, and (b) reduction in burn date uncertainty as compared to the original MCD64A1. The dotted line is drawn at the mean value.
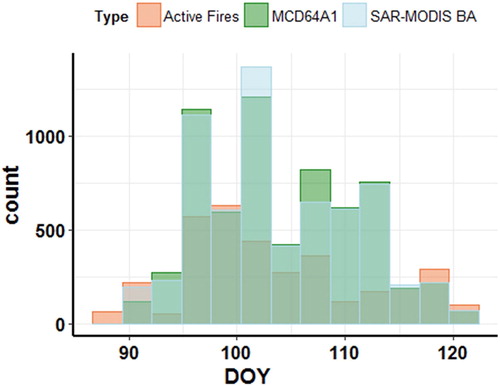
Figure 11. Histogram plot binned into approximately 3-d intervals showing the distribution of the day of year (DoY) of burning shown for the MODIS active fire points, original MCD64A1 pixels, and combined SARoptical burned area pixels.