Figures & data
Figure 1. (a) General location of the Río de la Plata and the study region, where the main tributaries UR (Uruguay river) and PR (Paraná river) are indicated, as well as relevant locations along the northern and southern coasts: CO (Colonia) and LP (La Plata) limiting the inner estuary, MO (Montevideo) and PP (Punta Piedras) limiting the intermediate zone, and PE (Punta del Este) and PR (Punta Rasa) indicating the boundary with the Atlantic Ocean. (b) Detail of the study zone of Punta del Tigre (PT), located to the W of MO (Montevideo), the capital city of Uruguay, and within the protected area of the Santa Lucía river. (c) Detail of the coast and bathymetry near the sampling stations.
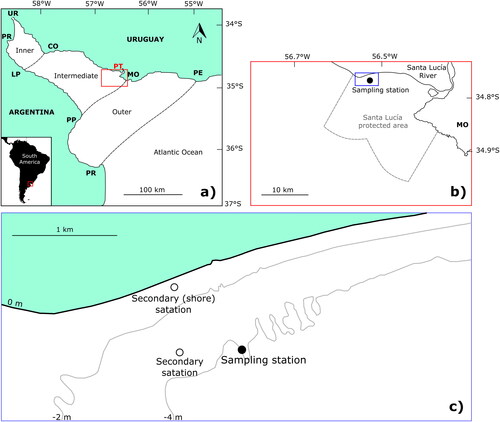
Figure 2. Field data time series at the study site: (a) temperature and salinity; (b) turbidity, total and fixed suspended solids (TSS and FSS, respectively); (c) extracted chl-a, CDOM absorption coefficient at 443 nm ( estimated from CDOM fluorescence), and the Santa Lucía river discharge (Q). Blue shades in (c) show periods of higher Santa Lucía Q (see text).
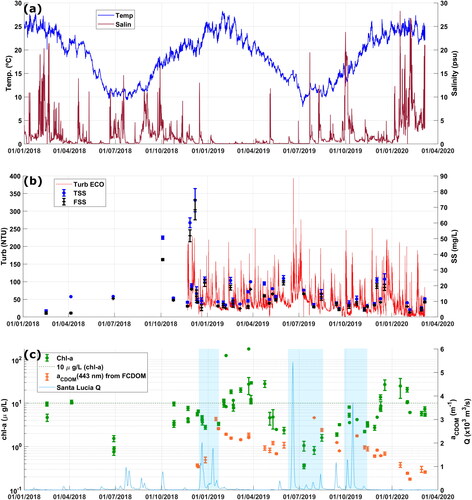
Table 1. Summary of field data collected at the sampling site when radiometric measurements were taken for the whole study period (2018–2020).
Figure 3. Regional calibration of the four selected chl-a indices: (a) 3BI, (b) NDCI, (c) and (d) SS(665), considering S2-MSI bands. Colours indicate turbidity estimated from the NIR band centred at ∼740 nm. Error bars represent the standard deviation of chl-a measurements (note that in some cases it was not available). None of the quadratic fits (panels (b) and (d)) was able to estimate chl-a levels lower than 2 μg/L approximately.
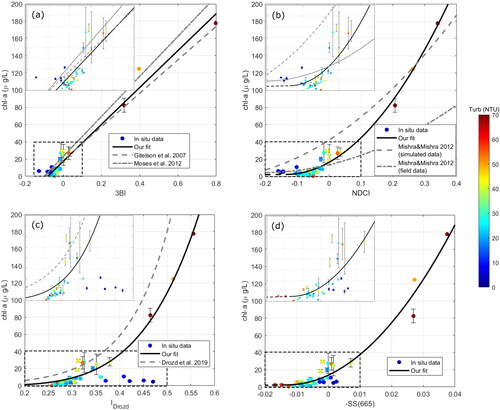
Table 2. Regional expressions for remote sensing estimation of chl-a concentrations () with the four selected indices. The number of data points (n), the root mean squared error (RMSE), and the determination coefficient (R2) of the fits are indicated (both computed in linear scale). (
) Expression is valid for
(**) Low turbidity samples were excluded from
fit (see text). (***) Expression is valid for
(equivalent to
).
Figure 4. Examples of chl-a retrievals at the study region for December 2, 2019: (a) with 3BI, (b) with NDCI, (c) with and (d) with SS(665); (e) the uncertainty was computed pixel-by-pixel as the interquartile range between estimations (a) to (c) relative to their median result; (f) turbidity levels were estimated from the NIR band centred at 740 nm.
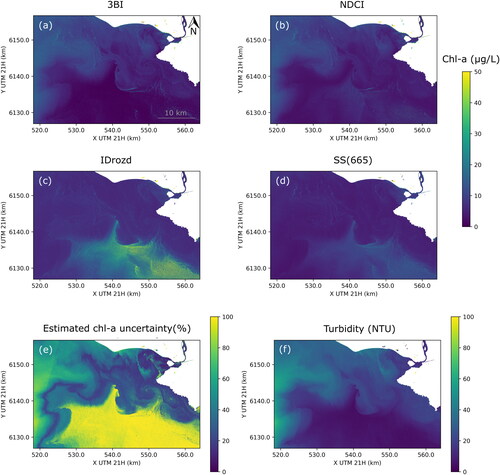
Figure 5. Same as but for December 17, 2019.
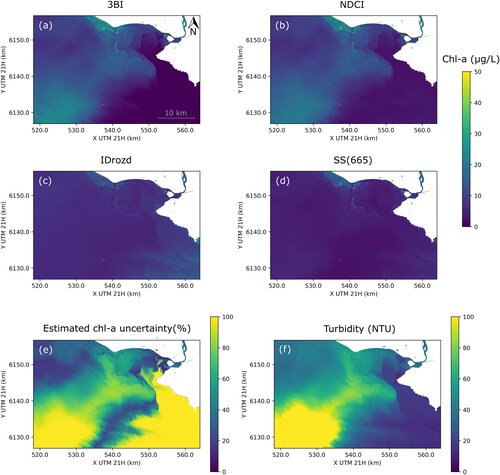
Figure 6. Chl-a threshold maps retrieved at the study region from S2-MSI images for the level of 10 μg/L, matching the two dates in and : (a) December 2 and (b) December 17, 2019. The regional algorithms for 3BI and SS(665) were used, and the highlighted areas in both panels indicate where none, one, or two of the indices estimated chl-a level above 10 μg/L.
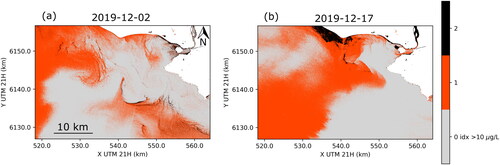
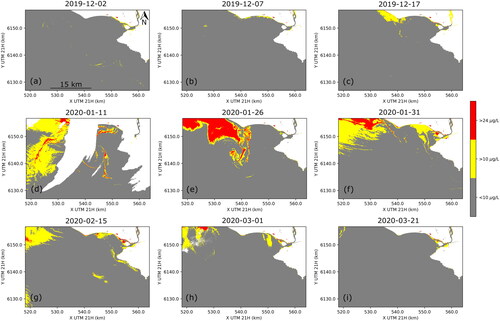
Figure 7. Sequence of chl-a threshold maps for the summer 2019–2020 obtained using S2-MSI imagery. Highlighted areas indicate where both indices 3BI and -SS(665) exceeded chl-a levels of 10 and 24 μg/L. Three consecutive smoothing (median) filters of 7, 5, and 3 pixels were applied to these maps.