
Figures & data
Figure 1. Flow chart of matching two linear features in different scales by DTW algorithm.
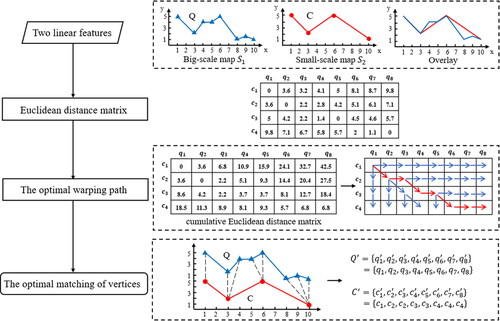
Figure 2. The simulated data with different levels of detail. (a) Large-scale representation. (b) Small-scale representation. (c) Overlapping representation.
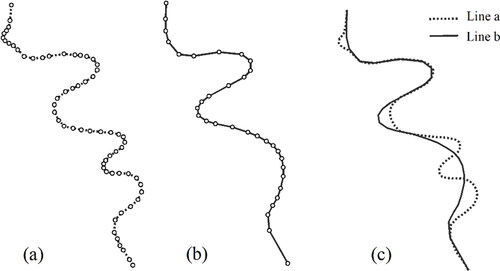
Figure 3. The corresponding relationship of vertices between line a and line b.
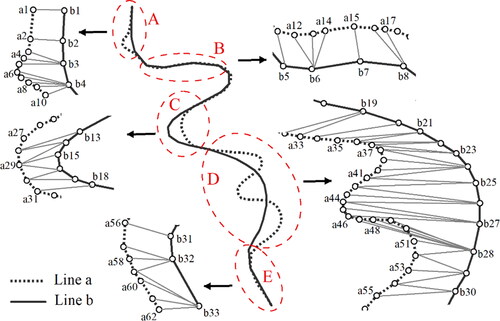
Figure 4. The morphing effect of DTW distance-based morphing method.
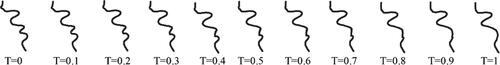
Table 1. Similarity distance of shapes between intermediate scales and initial scales by the proposed method for simulated data.
Figure 5. Overlaps of the morphing results through the (a). linear interpolation method; (b). Fourier transformation-based morphing method and (c). proposed DTW distance-based morphing method; (d)-(f). close-up of region G.
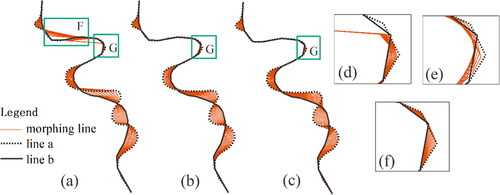
Figure 6. Similarity distance of shapes between intermediate scales and initial scales by linear interpolation method, Fourier transformation-based morphing method, and DTW distance-based morphing method.
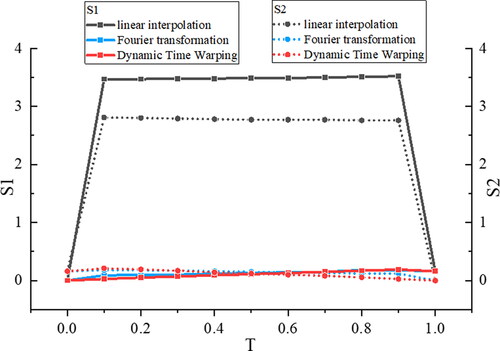
Figure 7. Continuous generalization of river networks by DTW distance-based morphing method.
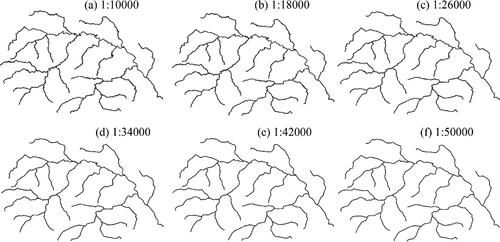
Figure 8. Continuous generalization of contour lines by DTW distance-based morphing method.
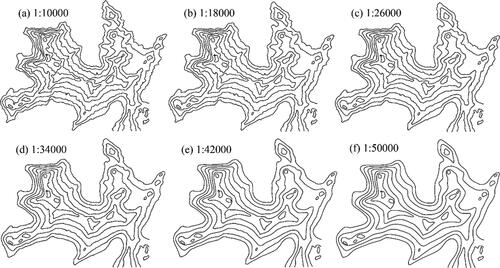
Table 2. Similarity distance of shapes between intermediate scales and initial scales for rivers and contours.
Code availability
The python code for the DTW algorithm to measure the similarity distance of linear features is available at the link: https://github.com/mao2023/mao_paper