Figures & data
Figure 1. Pléiades and WV-3 images of the Isfahan urban area for the years (a) 2012 and (b) 2016, respectively.
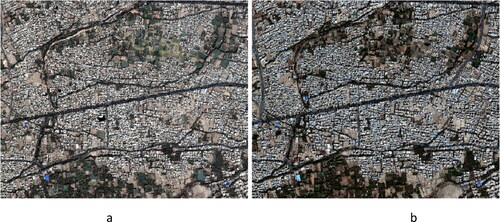
Table 1. Number of changed/unchanged pixels used as test/training data in each dataset.
Table 2. Implemented spectral distances.
Table 3. Accuracy assessment results of the applied CD methods in the urban (dataset 1) and agricultural (dataset 2) study areas.
Figure 2. Landsat 7 & 8 Satellite images of Zayandeh-Rud agricultural areas for (a) 2001 and (b) 2016.
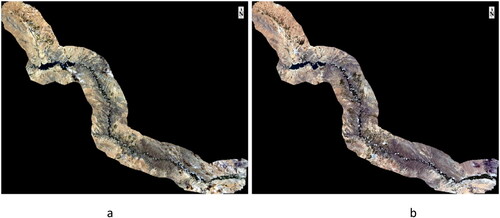
Figure 3. Spectral distance images (between Pléiades and WV-3 images of 2012 and 2016).
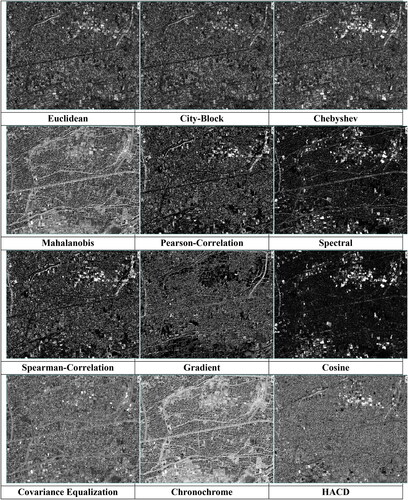
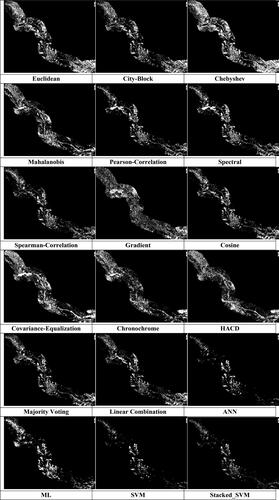
Figure 4. Binary change maps (changed: black and unchanged: white) produced by applying SCD and fusion methods using the Pléiades and WV-3 images.
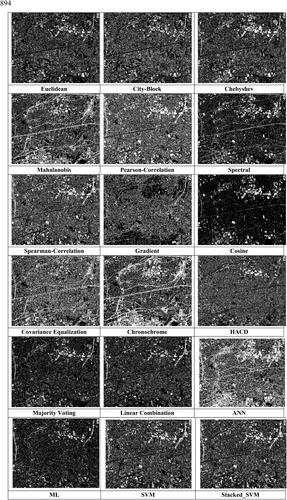
Figure 5. Change maps produced by applying SCD and fusion methods using the Landsat 7 & 8 images.