
Figures & data
Figure 1. The northern part of Qaa’Jahran location.
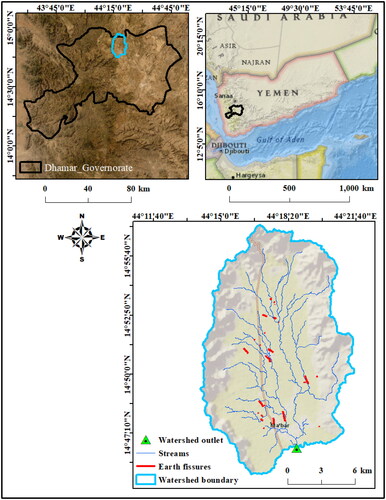
Figure 2. A general view of the flooded area following the heavy rain in Qaa’Jahran caused by the 17 August 2022 storm, a significant portion of flood water is contained in earth fissures.
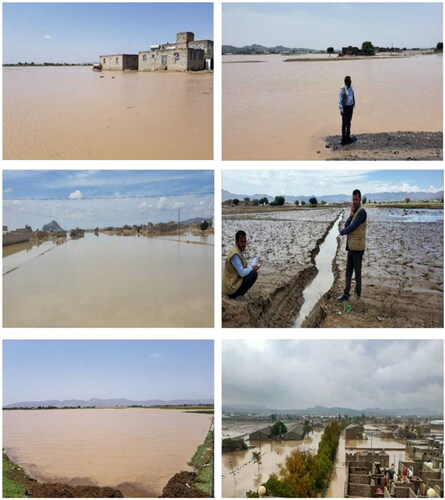
Figure 3. Qaa’Jahran digital elevation model (DEM).
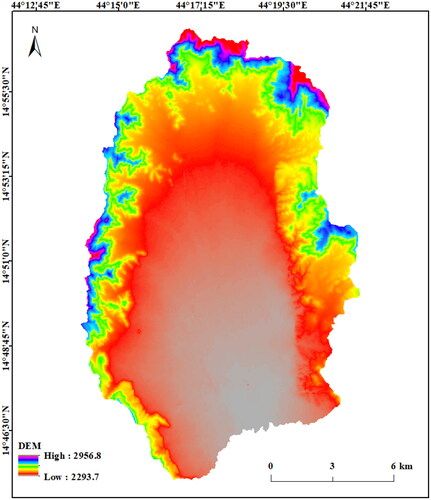
Figure 4. Soil type and land use.
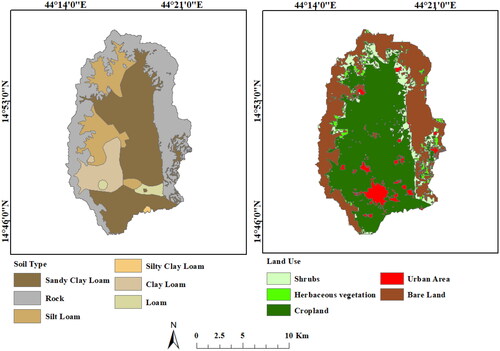
Table 1. The climatic factors in the study area during the two main rainfall seasons.
Figure 5. The 6-min hyetograph for the 100-year storm.
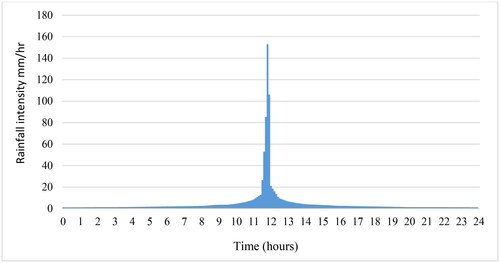
Figure 6. The temporal distribution of the 17 August 2022, storm event.
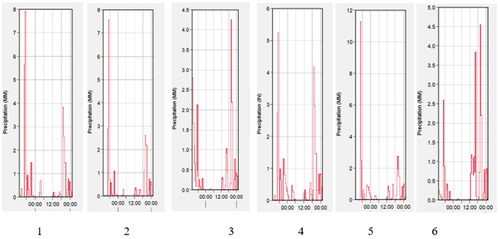
Table 2. Design storm for Qaa’Jahran Rusaba station.
Figure 7. A Flowchart illustrating the phases in the investigation of the floodplain.
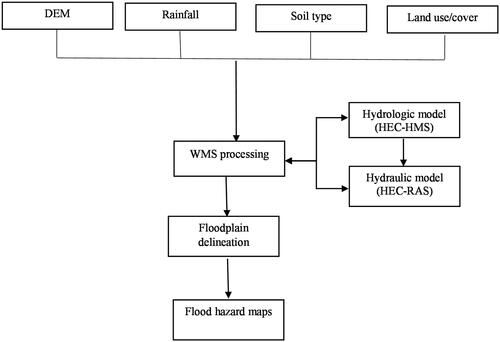
Figure 8. HEC-HMS basin model and GPM stations (red triangle) of the Qaa’Jahran watershed.
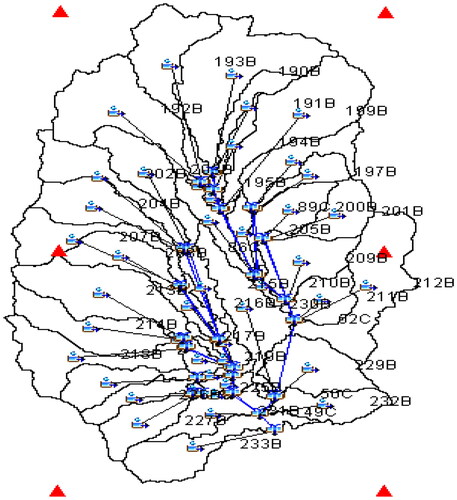
Figure 9. Sections and main reaches of the study area watershed.
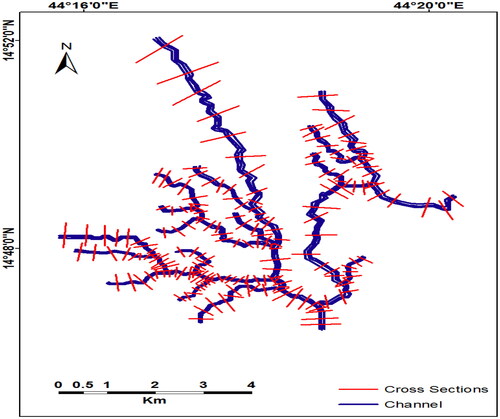
Figure 10. Outlet hydrograph of the study area for the storm event of February 2006.
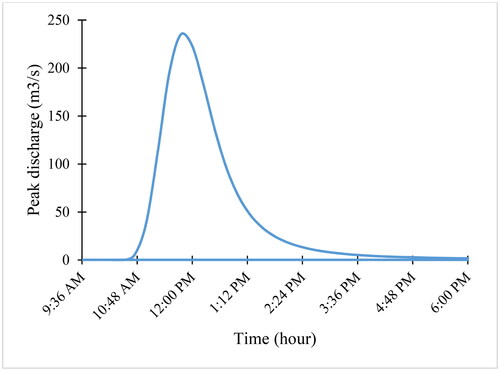
Figure 11. Flood risk map for (a) the entire watershed and (b) Mabar City.
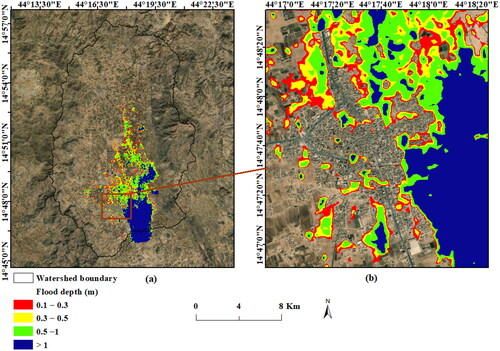
Figure 12. Flood inundation map developed by HEC-RAS model for 22 August 2022, storm event. The figure also shows the demarcation of the flooded areas based on the field survey conducted by the agricultural research Authority.
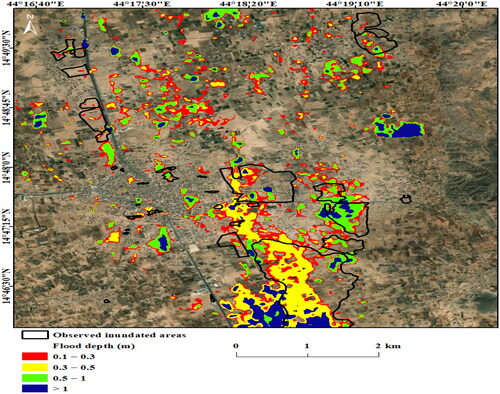
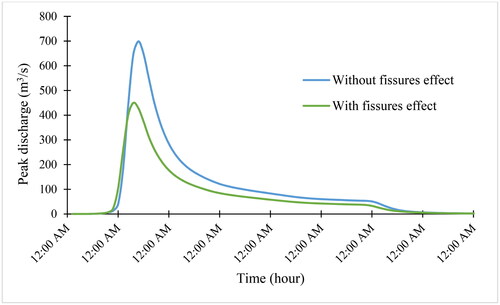
Figure 13. Outlet hydrograph of the study area for the storm event of 17 August 2022.
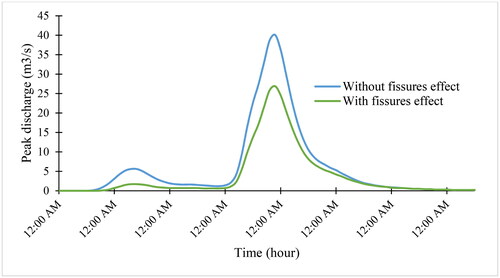
Figure 14. Flood risk map for the entire watershed (a) without the effect of earth fissures and (b) with the impact of earth fissures; (c) and (d) the same for Mabar City.
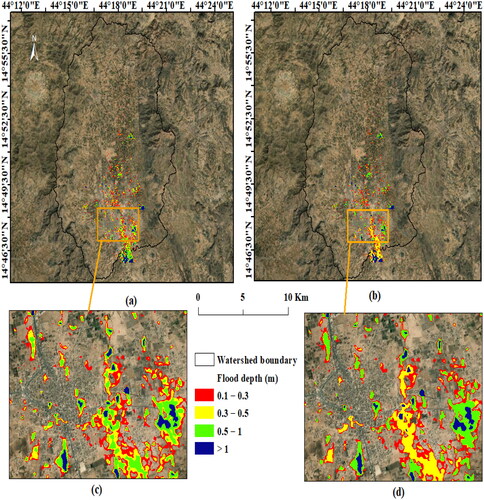
Table 3. Runoff volume, peak discharge and the differences for different return periods.
Figure 15. Outlet hydrograph of study area watershed for a return period of 100 years.
Data availability statement
Not applicable.