Figures & data
Figure 1. Location of the study area and distribution of the collected soil samples across main land use classes.
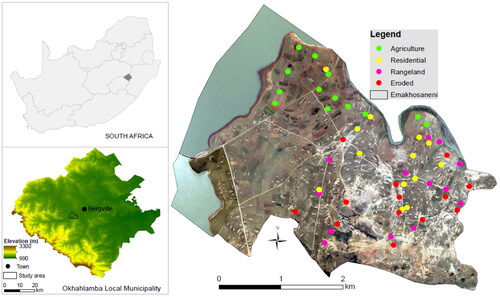
Figure 2. Overview of experimental setup.
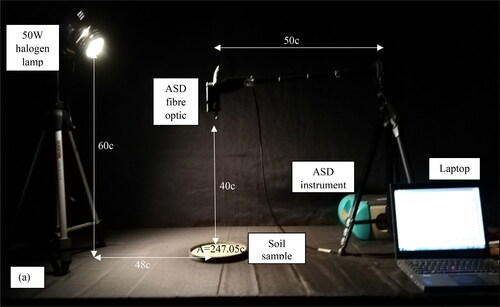
Figure 3. The reflectance curves showing the (a) raw spectra, (b) the reduced spectra, (c) the SG smoothened spectra, (d) the FDT transformed spectra of the soil samples, and (e) the combined pre-processed spectra (SG + FDT).
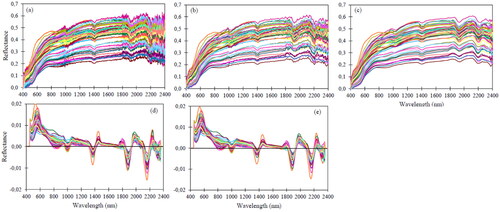
Table 1. Descriptive statistics of the SOM within the study area’s main land use classes.
Figure 4. The average spectral reflectance curves of soil samples obtained within each of the major land uses of the study area and the overall average spectral reflectance.
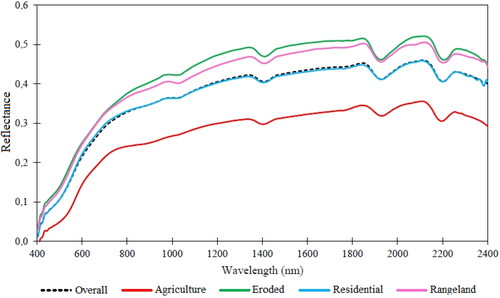
Figure 5. Calculated correlation coefficients between SOM content and spectral reflectance of: (a) all raw spectra, (b) all pre-processed spectra, (c) SG pre-processed agriculture spectra, (d) SG pre-processed residential spectra, (e) SG pre-processed eroded spectra, and (f) SG pre-processed rangeland spectra.
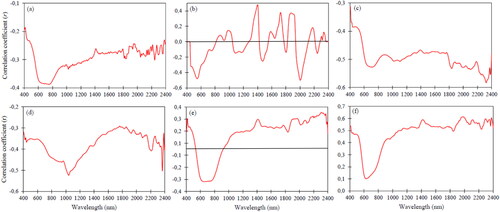
Table 2. The statistical summary of the different PLSR models created using raw and different pre-processed spectral data and SOM content.
Figure 6. Scatterplots of measured versus predicted SOM content using the four derived PLSR models: (a) R, (b) SG, (c) FDT and (d) SG + FDT.
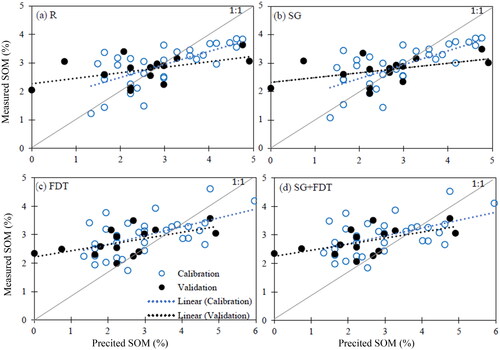
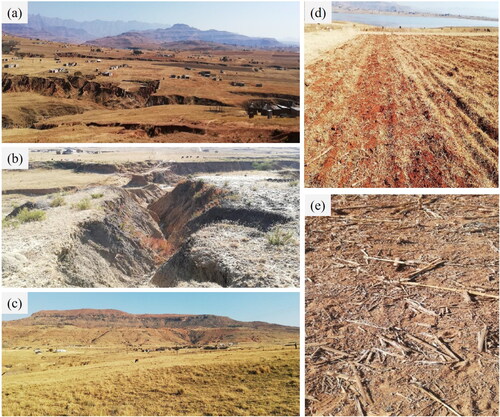
Figure 7. Landscape conditions in the study area; (a,b) severe erosion problem in the Central and Eastern parts, (c) rangeland in the Central Eastern parts, (d) agricultural areas in the fallow time, (e) and maize crop residues dispersed in the farm.