Figures & data
Fig. 1: Longitudinal view and cross-section of the investigated tunnel section, together with the dimensions, tunnel support structure and partial excavation scheme
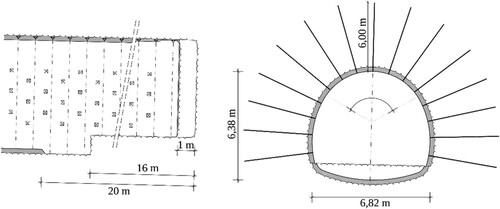
Fig. 2: Illustration of the geology in the investigated section
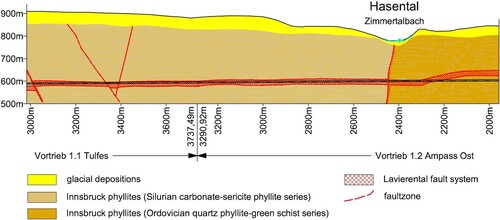
Fig. 3: 2D plane strain model of the emergency tunnel, with the boundary and initial conditions and the excavation profile: top heading and bench (excavated simultaneously) and invert
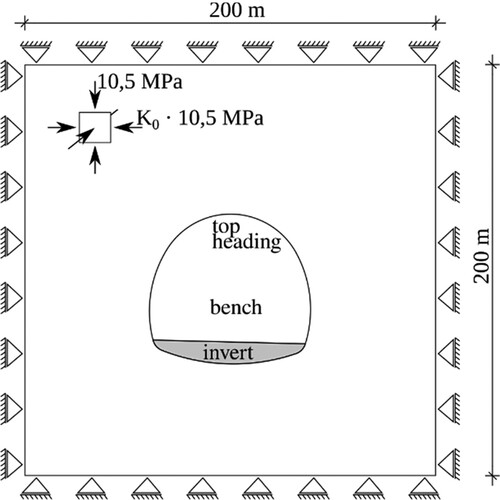
Fig. 4: Finite element mesh after excavation of the top heading and the bench (left) and after excavation of the invert and placement of the complete shotcrete lining (right)
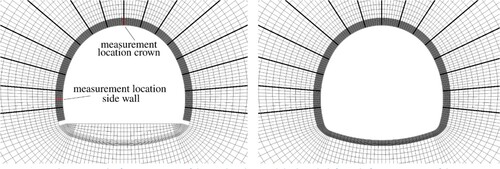
Fig. 5: Assumed time-dependent stress release layout after excavation of the top heading and the bench in the 2D finite element model
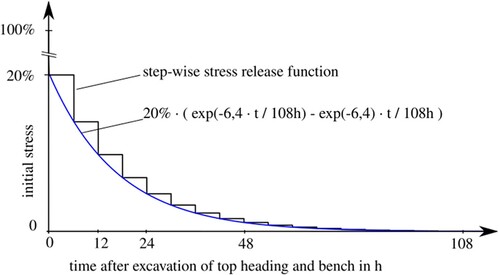
Table 1: Shotcrete composition used for the permanent shotcrete lining in the emergency tunnel
Fig. 6: Molds for spraying directly cylindrical specimens (left), molds and spray boxes placed at the tunnel site (center), and spraying of cylindrical specimens at the tunnel face (right)
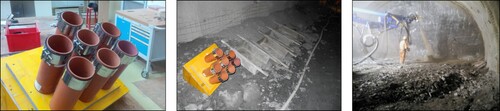
Fig. 7: Sprayed shotcrete specimen, unmolded 6 h after spraying (left), unsealed specimen for determining the uniaxial compressive strength (center), and sealed specimen mounted in a hydraulic creep test bench (right)
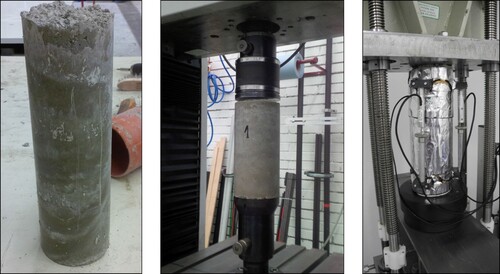
Table 2: Calibrated material parameters for the shotcrete damage plasticity (SCDP) model
Fig. 8: Predicted evolution of the uniaxial compressive strength (left) and the Young's modulus (right): experimentally determined values from Ref. [Citation17] and additional experimental data from 2018,Citation19 and predictions by the calibrated shotcrete damage plasticity (SCDP) model
![Fig. 8: Predicted evolution of the uniaxial compressive strength (left) and the Young's modulus (right): experimentally determined values from Ref. [Citation17] and additional experimental data from 2018,Citation19 and predictions by the calibrated shotcrete damage plasticity (SCDP) model](/cms/asset/65c7449e-13ca-4699-abc2-6747f48af15f/tsei_a_1735979_f0008_c.jpg)
Fig. 9: Predicted evolution of the vertical displacement at the crown and horizontal displacement at the side wall, and statistical bandwidth according to geodetic measurements
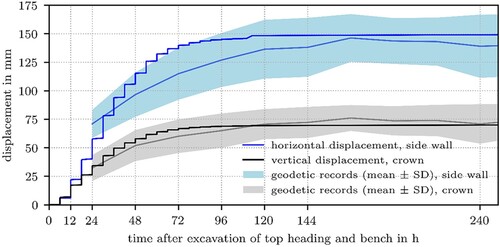
Fig. 10: Predicted evolution of the circumferential stress at the rock–shotcrete interface and the free surface at the crown and the side wall
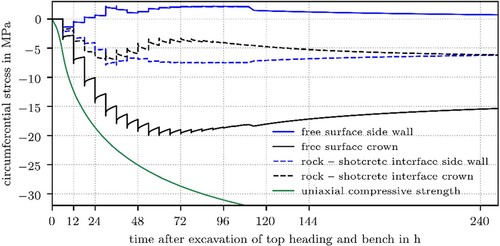
Fig. 11: Predicted evolution of the longitudinal stress at the rock–shotcrete interface and the free surface at the crown and the side wall
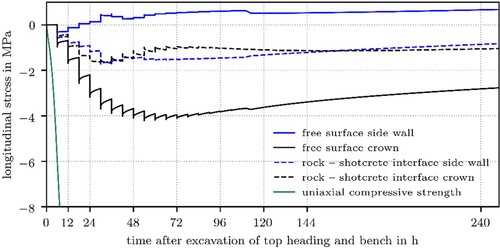
Fig. 12: Predicted circumferential stress (left) and longitudinal stress (right) along the shotcrete lining at the rock–shotcrete interface and the free surface for t = 54 h and t = 108 h
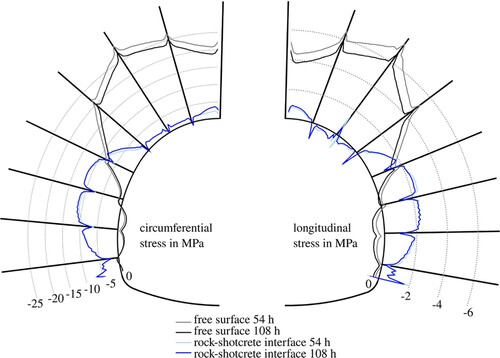
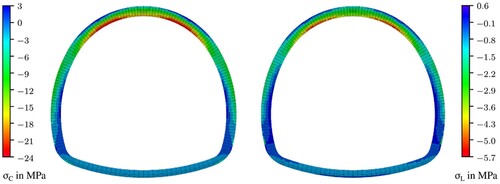
Fig. 13: Contour plot of the circumferential stress (left) and the longitudinal stress
(right) acting in the shotcrete lining 132 h after excavation of the top heading and the bench, i.e. 24 h after placement of the lower part of the lining