Figures & data
Table 1 Clinicopathological features of ITP patients and controls
Table 2 Primers of GRα, GRβ, GRγ, GRP, and GAPDH
Table 3 Expression of four GR isoform mRNAs in ITP patients and controls
Figure 1 Melting curve of GAPDH, GRα, GRβ, GRγ, and GRP.
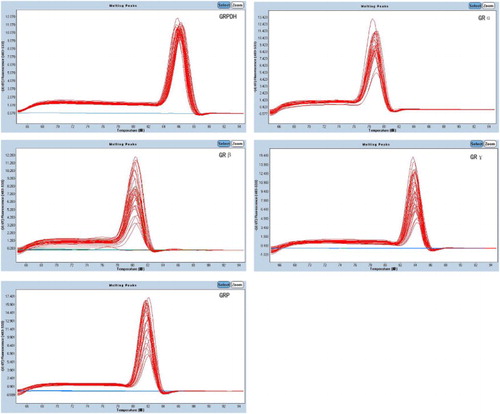
Figure 2 Image of an electrophoresis gel of PCR products of GRα, β, γ, and P. Single band of PCR products showed the absence of other non-specific products among the PCR products.
Figure 3 (A) Expression of GRα, β, γ, and P mRNA in the ITP and control groups. (B) Correlations between GRα and GRP in ITP patients and controls.
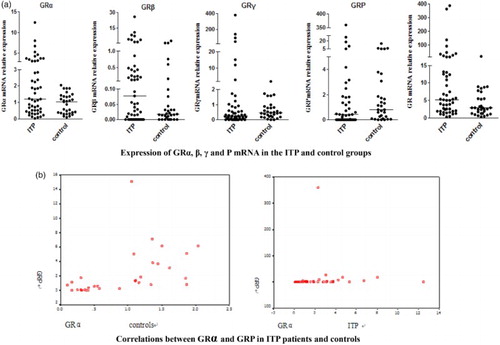
Figure 4 Expression of GRα, β, γ, and P mRNA in the GC-sensitive group, GC-resistant group, and the control group.
Table 4 Expression of four GR isoform mRNAs in GC-sensitive, GC-resistant, and control groups
Figure 5 GRα protein expression in the GC-sensitive group (n = 6), GC-resistant group (n = 6), and the control group (n = 6). Note:*P < 0.05.