Figures & data
Figure 1. Experimental design of experiments 1 and 2. SNCT: sucrose negative contrast test; NSF: novelty suppressed feeding; EPM: elevated plus maze; FST: forced swim test.
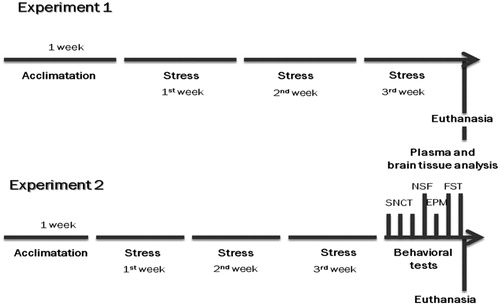
Table 1. Schedule of chronic stress by movement restraint with variable duration.
Figure 2. Chronic stress decreased body weight gain in Experiments 1 (A) and 2 (B). Experiment 1 included 10 CTL and 18 CUMR rats. Experiment 2 included 26 CTL and 33 CUMR animals. *Difference from controls, p < 0.001; #difference from the first week, p < 0.001; ‡difference from the second week, p < 0.01 (two-way ANOVA repeated measures). Values are shown as mean ± s.e.m.
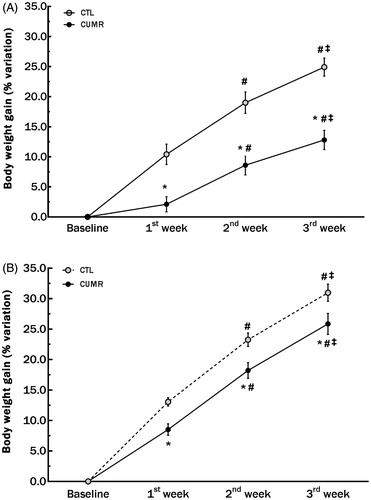
Figure 3. Chronic stress increased pro-inflammatory cytokine levels (normalized by total protein level in the tissue) in the hippocampus. (A) IL-1α; p < 0.2; (B) IL-1β; p = 0.003; (C) IL-2; p < 0.02; (D) IL-6; p < 0.03; (E) IL-10; p = 0.002; (F) TNF-α; p < 0.09. Values are shown as mean ± s.e.m. of 10 CTL and 18 CUMR rats. *Difference from CTL.
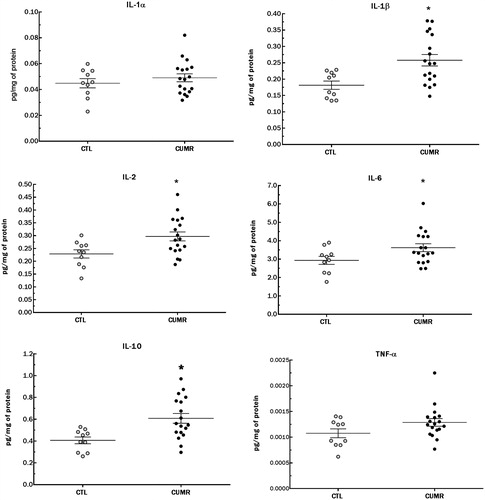
Table 2. Correlation matrix between hippocampal cytokines.
Table 3. Results of corticosterone (CORT) levels, novelty suppressed feeding (NSF) and elevated plus maze (EPM) tests.
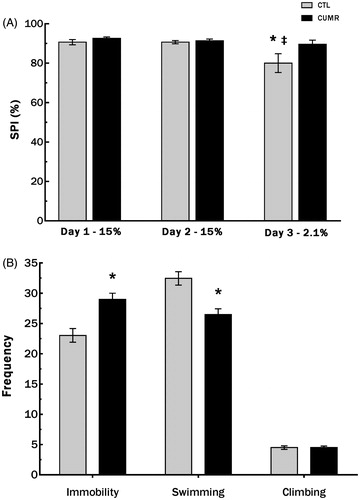
Figure 4. Chronic stress did not reduced sucrose preference for the less palatable solution rats and increased the frequency of immobility and reduced the frequency of swimming of CUMR animals in the forced swim test. (A) Sucrose preference in the Sucrose Negative Contrast Test; (B) behaviors in the forced swim test. Values are shown as mean ± s.e.m. of n = 26 CTL and 33 CUMR rats. *Difference from CTL, p < 0.001 (Student’s t test); ‡difference from day 2 (two-way ANOVA repeated measures); p = 0.003.