Figures & data
Figure 1. The effect of acute (1D) and repeated (4D) resident/intruder stress on the Per2, Nr1d1, and Bdnf expression in the prefrontal cortex (PF), hippocampus (Hipp), pineal gland (PG), olfactory bulbs (OB), cerebellum (CRB) and pituitary gland (Pit). mRNA levels were determined using quantitative RT-PCR, and values of intruders (black columns) and residents (gray columns) were converted to a percentage of the control values, which were considered baseline (zero) levels. Two-way ANOVA with Tukey’s multiple comparisons test: *p < 0.05; **p < 0.01; ***p < 0.001; ****p < 0.0001 between control and stressed groups; #p < 0.05; ##p < 0.01; ###p < 0.001; ####p < 0.0001, between intruders and residents; §p < 0.05; §§p < 0.01; §§§p < 0.001; §§§§p < 0.0001, between 1D and 4D sessions. The data are expressed as means ± SEM from six animals.
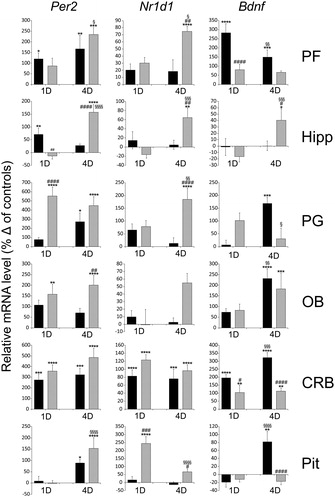
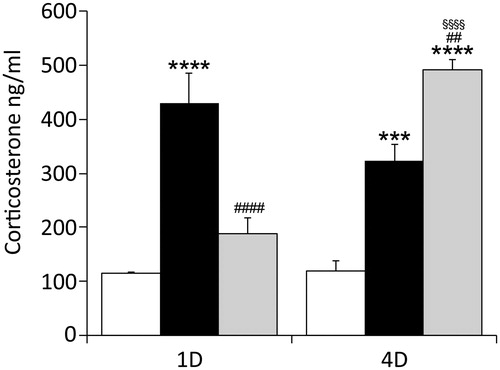
Figure 2. The effect of acute and repeated R/I stress on the plasma corticosterone level. The 30 min exposure to R/I elevated the level of corticosterone within 1 h (1D) in the group of intruders (black columns), compared to controls (white columns). Repeated, 4 day exposure (4D) elevated level in intruders as well as in residents (grey columns). Two-way ANOVA with Tukey’s multiple comparisons test: *p < 0.05; **p < 0.01; ***p < 0.001; ****p < 0.0001 between control and stressed groups; #p < 0.05; ##p < 0.01; ###p < 0.001; ####p < 0.0001, between intruders and residents; §p < 0.05; §§p < 0.01; §§§p < 0.001; §§§§p < 0.0001, between 1D and 4D sessions.The data are expressed as means ± SEM from six animals.