
Figures & data
Figure 1. Baseline salivary testosterone and cortisol concentration in athletic women collapsed across testing days (1 A, 1B) and stressor type (1 C, 1 D). Data are plotted as geometric marginal means (red diamonds) with a 95% CI overlaying a box plot with individual observations (grey circles). D7 = day 7, D14 = day 14, D21 = day 21. *D14 is significantly different from D7 and D21 p < 0.01, #Significant difference between stressors p < 0.01.
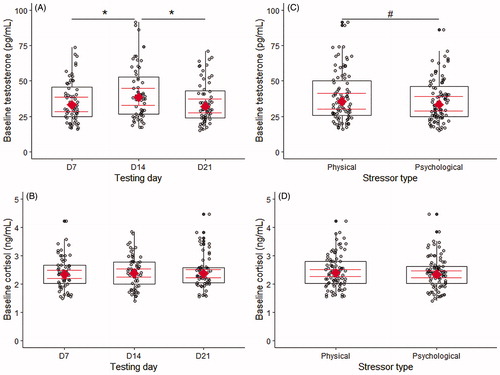
Figure 2. Change scores in log-transformed salivary testosterone and cortisol concentration in athletic women collapsed across testing days (A, B) and stressor type (C, D). Data are plotted as marginal means (red diamonds) with a 95% CI overlaying a box plot with individual observations (grey circles). D7 = day 7, D14 = day 14, D21 = day 21. *D14 is significantly different from D7 and D21 p < 0.01, #Significant difference between stressors p < 0.01.
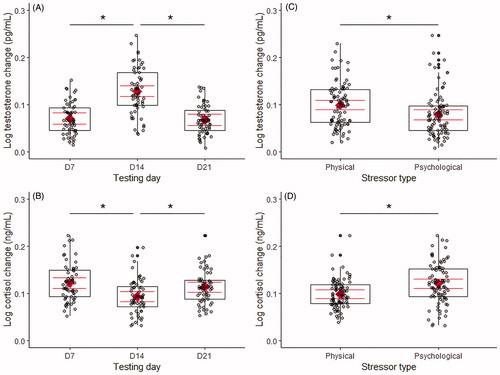
Table 1. Regression models predicting the acute testosterone response to the physical and psychological stressors.
Table 2. Regression models predicting the acute cortisol response to the physical and psychological stressors.
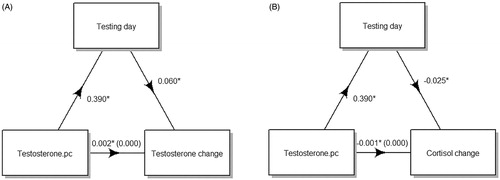
Figure 3. Mediating effect of testing day on the baseline person-centered testosterone (testosterone.pc) relationship with the testosterone (A) and cortisol (B) change score measures. The coefficients in parentheses indicate the relationship between baseline testosterone.pc and each hormonal change score, controlling for testing day. *Denotes a significant effect p < 0.05.
Data availability statement
The study data are not publicly available due to privacy issues.