
Figures & data
Figure 1. Example of patient-specific abdominal aortic aneurysm (AAA) geometry (Patient 1): (a) AAA model segmented from CTA image – sagittal view, and (b) a cross-section of AAA geometry showing the intraluminal thrombus (ILT), lumen, and AAA external wall (blue color) created automatically using BioPARR (Joldes et al. Citation2017).
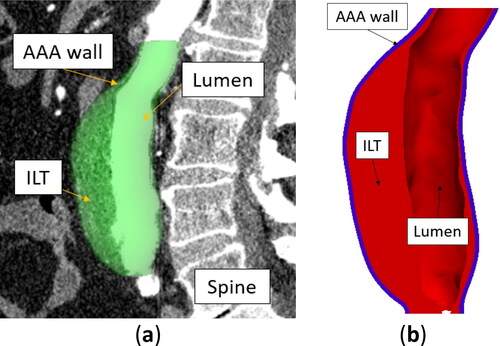
Table 1. Tetrahedral and hexahedral finite elements from ABAQUS finite element code library (Abaqus Citation2018) analysed in this study.
Figure 2. Example of finite element meshes generated in this study (Patient 3). Blue color: aneurysm wall (with a constant wall thickness of 1.5 mm). Red color: intraluminal thrombus (ILT) meshed using tetrahedral elements. (a) Tetrahedral meshes of aneurysm wall, and (b) hexahedral meshes of aneurysm wall. Both meshes have two layers of elements through the wall thickness.
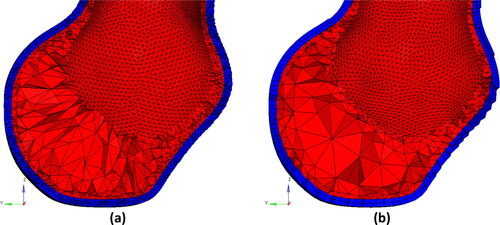
Figure 3. Histograms of the maximum principal stress in the aneurysm wall (Patient 1) calculated using tetrahedral and hexahedral finite element meshes with different number of elements through the wall thickness (1 layer, 2 layers, 4 layers and 8 layers of elements) and for different element type/formulation (a) Quadratic tetrahedra with displacement formulation (C3D10); (b) Quadratic tetrahedra with hybrid formulation (C3D10H); (c) Linear hexahedra with displacement (C3D8) and hybrid (C3D8H) formulations. Only three histograms are visible as the results for C3D8 and C3D8H overlap; (d) Linear hexahedra with reduced integration, and displacement (C3D8R) and hybrid (C3D8RH) formulations. Only three histograms are visible as the results for C3D8R and C3D8RH overlap; (e) Quadratic hexahedra with displacement formulation (C3D20); (f) Quadratic hexahedra with hybrid formulation (C3D20H), (g) Quadratic hexahedra with reduced integration and displacement formulation (C3D20R), and (h) Quadratic hexahedra with reduced integration and hybrid formulation (C3D20RH).
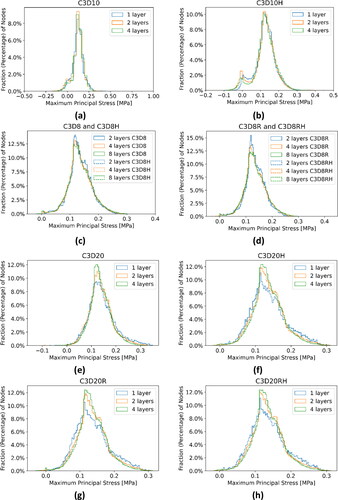
Figure 4. (a) Contour plots of the maximum principal stress (MPS) including residual stress (RS) obtained using C3D10H 10-noded quadratic tetrahedral hybrid elements (left-hand-side figures) and C3D20RH 20-noded quadratic hexahedral hybrid elements with reduced integration (right-hand-side figures) for the aneurysm wall; and (b) percentile plots of MPS for the studied AAA patients.
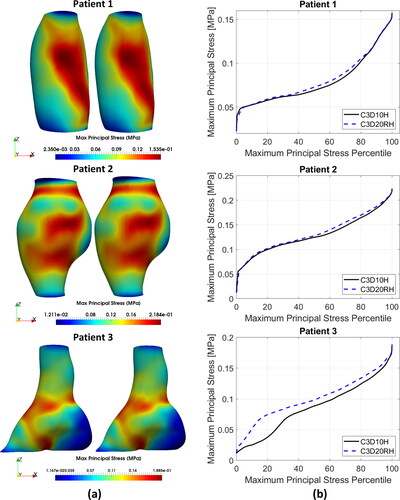
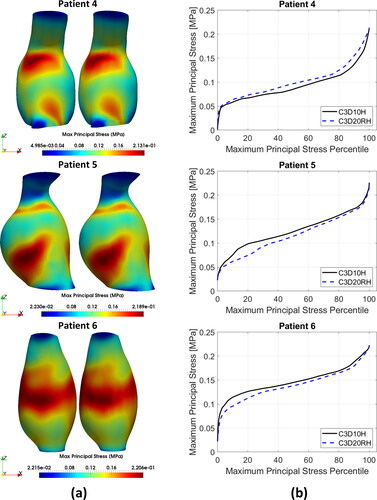
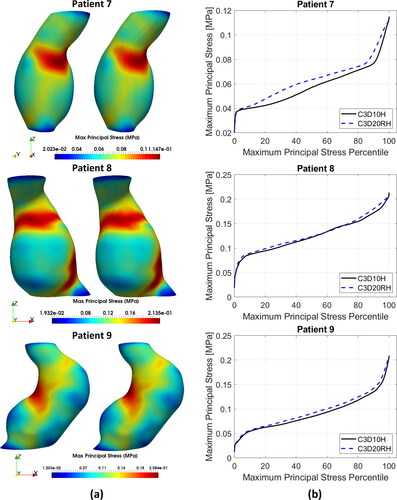
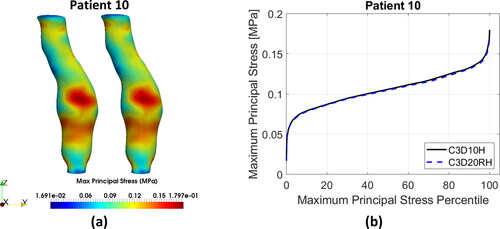
Figure A1. AAA biomechanical analysis (the figure shows the pressure distribution in MPa) for Patient 1 using finite element mesh constructed with 10-noded quadratic displacement-based tetrahedral elements (element type C3D10 in ABAQUS finite element code). Volumetric locking, as indicated by nonphysical chess-board-like pattern of the pressure distribution, is clearly visible.
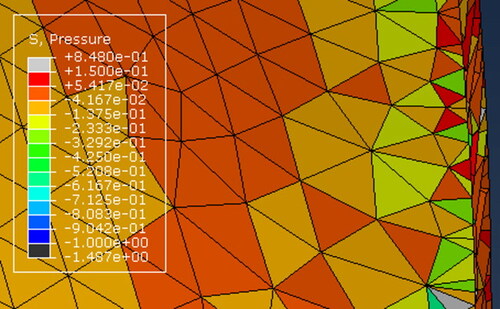
Table A1. Summary of the patient-specific computational biomechanics finite element (FE) models of AAA created and used in this study; a total of 60 models. The number of elements through the wall thickness determines the AAA mesh density. ILT is the intraluminal thrombus. The symbol ✗ indicates that ILT was not included in the model.
Table A2. Tetrahedral (tetra) and hexahedral (hexa) AAA wall mesh with two layers of elements through the wall thickness generated in this study: number of elements, percentage of poor-quality elements with respect to the total number of elements for each part, and values of mesh quality measures.
Table A3. Solution convergence and computation time for displacement-based (elements C3D10, C3D8, C3D8R, C3D20, and C3D20R) and hybrid (elements C3D10H, C3D8H, C3D8RH, C3D20H, and C3D20RH) finite element (FE) formulations. MPS = maximum principal stress, GCI=grid convergence index (Equation 2), p=order of convergence (Equation 3), and festimated= estimated asymptotic solution. Refer to Table A1 for more information about the models. For models 4, 6, 8, 12, 20, and 28, p, GCI and festimated could not be obtained due to the solution inconsistency.
Table A4. Computation time, peak maximum principal stress (MPS), relative absolute difference in the peak value of MPS between tetrahedral and hexahedral meshes for the studied AAAs. C3D10H is fully integrated quadratic tetrahedron using hybrid formulation. C3D20RH is quadratic hexahedron using hybrid formulation and reduced integration. Relative absolute difference was calculated as the absolute difference between the peak MPS obtained using C3D10H (MPSC3D10H) and C3D20RH (MPSC3D20RH) elements divided by the peak MPS obtained using C3D20RH elements: