Figures & data
Table 1 Antibody characteristics for western blots
Table 2 Animal characteristics experiment 1
Figure 1 IOD of Evans blue dye in the ME after chow (n = 5, white bar) and 1-week fcHFHS diet (n = 4, black bar) (A) and representative images of Evans blue dye in the ME and Arc of the hypothalamus of a chow and fcHFHS diet animal. White asterix depicts third ventricle (B). Data are expressed as mean ± SEM.
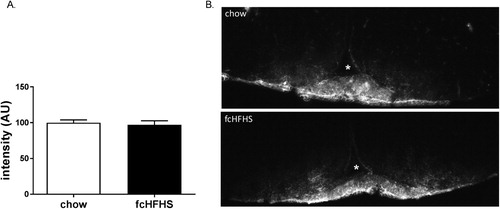
Table 3 Animal characteristics experiment 2
Figure 2 Representative western blots on hypothalamic tissue lysates of two fcHFHS diet-fed (left bands) and two chow-fed animals (right bands) for ZO-1, occludin, and GLUT-1 protein, with β-actin protein as control for amount of protein loaded. Claudin-5 bands are shown of lysates of two fcHFHS diet animals on the left and right, and three chow-fed animals in the middle. Molecular weight is depicted next to blots.
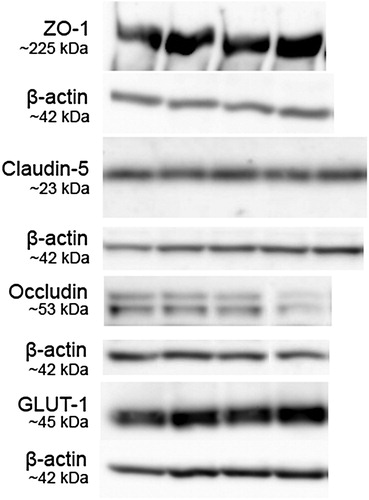
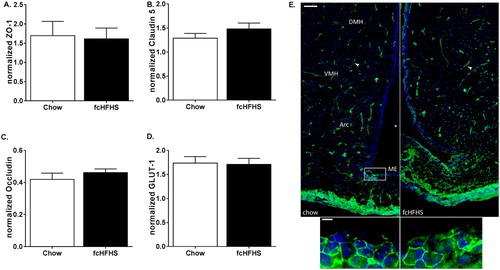
Figure 3 Effects of 1 week fcHFHS (n = 6, black bars) compared to chow (n = 8, white bars), on ME-Arc area protein expression of ZO-1 (A), claudin-5 (B), occludin (C), and GLUT-1 (D). Data are expressed as mean ± SEM. Right: ZO-1 immunoreactivity in coronal sections of the ME and third ventricle of a representative chow-fed and fcHFHS-fed rat. Arrowheads indicate immunopositive staining for ZO-1 (scale bar 100 µm). Lower two images are a magnification of the border of the ME with the honeycomb pattern of ZO-1 (green, scale bar 10 µm) and. Cells where counterstained with Hoechst 33342 (blue).
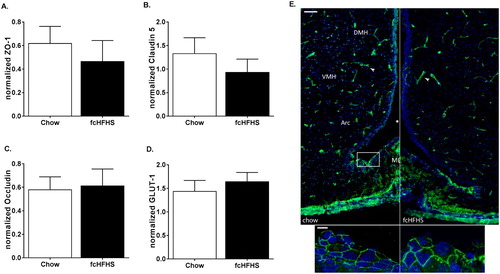
Figure 4 IOD of Evans blue dye in the ME in chow-fed (n = 4, white bar) and fasted chow (n = 5, gray bar) and fcHFHS animals (n = 5, black bar) (A) and representative images of Evans blue dye in the ME and Arc of the hypothalamus of a chow-fed, fasted chow and fcHFHS diet animal. White asterix depicts third ventricle (B). Data are expressed as mean ± SEM.
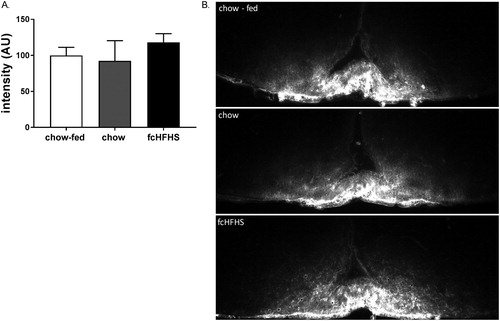
Figure 5 Effects of 1 week fcHFHS (black bars) diet compared to chow (white bars) (n = 8, per group), after overnight fast, on ME-Arc area protein expression of ZO-1 (A), claudin-5 (B), occludin (C), and GLUT-1 (D). Data are expressed as mean ± SEM. Right: ZO-1 immunoreactivity in coronal sections of the ME and third ventricle of a representative fasted chow and fcHFHS diet rat. Arrowheads indicate immunopositive staining for ZO-1 (scale bar 100 µm). Lower two images are a magnification of the border of the ME with the honeycomb pattern of ZO-1 (green, scale bar 10 µm) and. Cells where counterstained with Hoechst 33342 (blue).