Figures & data
Table 1 Composition of the experimental dietsa.
Figure 1 Schematic layout of the experiment. Male ApoE−/− mice arrived at the age of 7 weeks and were allowed to adjust to the environment and the diets for one week. Mice fed solLB diet showed signs of intolerance to the diet during the 1-week acclimatization period and were switched back to standard chows before resuming the solLB at the age of 14 weeks. The experiment therefore consisted of two sets; (1) the first set of the experiments, the HF diets with 60 g/kg dietary fibre from wLB (n=10), insLB (n=10) or cellulose (HF-control1, n=10) were given for 8 weeks, starting when the mice were 8-weeks-old 2) the second set of the experiments, solLB diet (n=10), which contained 15 g/kg of dietary fibre from solLB fraction and 45 g/kg from cellulose, was given to the mice for only a total period of 2 weeks, starting when the mice were 14-weeks old. As a control in this experiment, a group of mice given the HF control diet for only 2 weeks (HF-control2, n=6), was included.
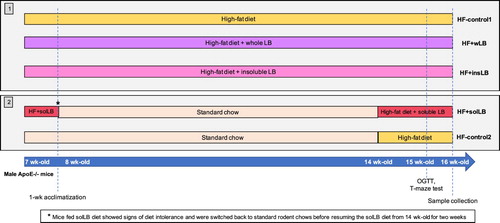
Figure 2 Dietary intake, body and organ weights, and blood glucose levels after OGTT of mice fed a HF diet with cellulose for 8 weeks (HF-control1, n=7) or for 2 weeks (HF-control2), or with whole LB (wLB, n=7) or insoluble fraction of LB (insLB, n=7) for 8 weeks, or with soluble fraction of LB (solLB, n=8) for 2 weeks. (A) Total dietary intake and (B) total caloric intake during 8-week feeding in mice fed HF-control1 and HF diets containing wLB, insLB, or during 2-week feeding in mice fed HF-control2 and HF with solLB. (C) Body weight gain (g) during the feeding periods. (D) epidydimal fat pad, (E) liver, (F) caecum, and (G) spleen weights, relative to the body weight (g/g bw). (H) Blood glucose level and (I) area under curve (AUC) of blood glucose during 120 min following OGTT. Data represent mean±SEM, each dot represents a single mouse. Mice fed HF diets containing wLB or insLB were compared to HF-control1 using one-way ANOVA and Dunnett's multiple comparisons test. Mice fed HF diet with solLB were compared to HF-control2 using a Student’s t-test. *P<0.05, **P<0.01, ***P<0.001, ****P<0.0001.
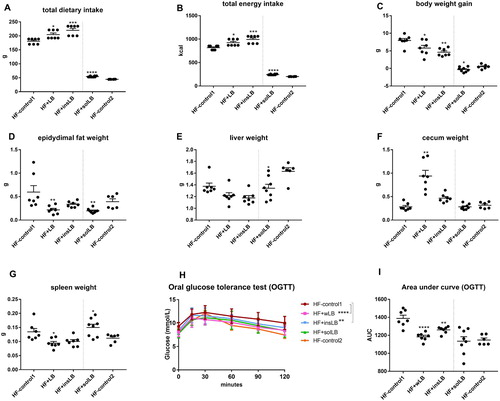
Figure 3 Blood lipid profiles and percentage lesion of the atherosclerotic plaque in aorta of mice fed a HF diet with cellulose for 8 weeks (HF-control1, n=7) or for 2 weeks (HF-control2), or with whole LB (wLB, n=7) or insoluble fraction of LB (insLB, n=7) for 8 weeks, or with soluble fraction of LB (solLB, n=8) for 2 weeks. Plasma (A) total cholesterol, (B) HDL-cholesterol, (C) LDL-cholesterol, (D) triglycerides (TG), and (E) TG/HDL ratio. (F) percentage atherosclerotic lesion per total aorta vessel area. Data represent mean±SEM, each dot represents a single mouse. Mice fed HF diets containing wLB or insLB were compared to HF-control1 using one-way ANOVA and Dunnett's multiple comparisons test. Mice fed HF diet with solLB were compared to HF-control2 using a Student’s t-test. *P<0.05, **P<0.01.
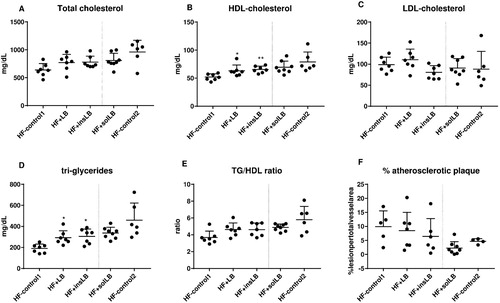
Figure 4 Composition of the gut microbiota at (A) phylum and (B) genus levels in the caecum of mice fed a HF diet with cellulose for 8 weeks (HF-control1, n=7) or for 2 weeks (HF-control2), or with whole LB (wLB, n=7) or insoluble fraction of LB (insLB, n=7) for 8 weeks, or with soluble fraction of LB (solLB, n=8) for 2 weeks. Data in (A) represent mean values. Data in (B) represent mean±SEM. Mice fed HF diets containing wLB or insLB were compared to HF-control1 using one-way ANOVA and Dunnett's multiple comparisons test. Mice fed HF diet with solLB were compared to HF-control2 using a Student’s t-test. *P<0.05, **P<0.01, ***P<0.001, ****P<0.0001.
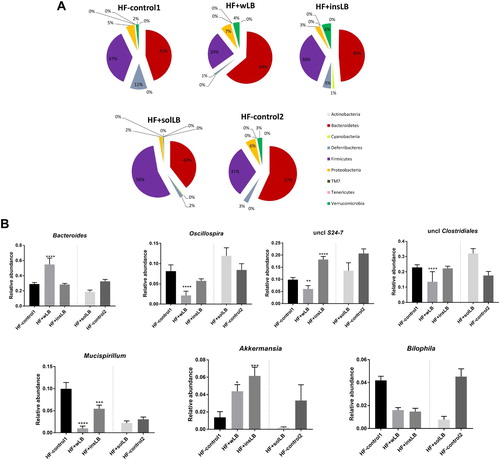
Figure 5 Caecal amounts (µmol) of (A) total SCFAs, (B) acetic-, (C) propionic- and (D) butyric acids of mice fed a HF diet with cellulose for 8 weeks (HF-control1, n=7) or for 2 weeks (HF-control2), or with whole LB (wLB, n=7) or insoluble fraction of LB (insLB, n=7) for 8 weeks, or with soluble fraction of LB (solLB, n=8) for 2 weeks. Data represent mean±SEM, each dot represents a single mouse. Mice fed HF diets containing of wLB or insLB were compared to HF-control1 using one-way ANOVA and Dunnett's multiple comparisons test. Mice fed HF diet with solLB were compared to HF-control2 using a Student’s t-test. *P<0.05, **P<0.01.
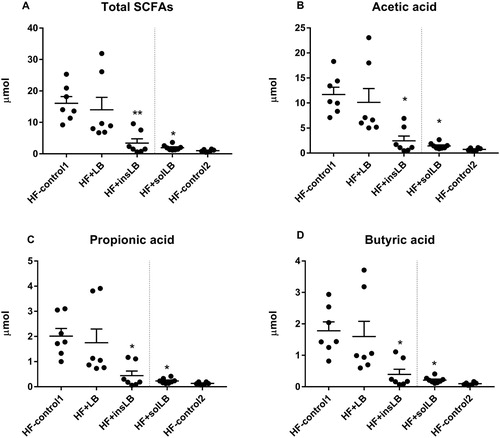
Figure 6 S100B protein concentration (pg/µg total protein) in different parts of SI, in colon, and in different parts of the brain of mice fed a HF diet with cellulose for 8 weeks (HF-control1, n=7) or for 2 weeks (HF-control2), or with whole LB (wLB, n=7) or insoluble fraction of LB (insLB, n=7) for 8 weeks, or with soluble fraction of LB (solLB, n=8) for 2 weeks. S100B concentration in (A) proximal, (B) distal and (C) middle part of SI, (D) in colon, and in cerebral (E) hippocampus, (F) cerebellum, (G) hemisphere. Data represent mean±SEM, each dot represents a single mouse. Mice fed HF diets containing wLB or insLB were compared to HF-control1 using one-way ANOVA and Dunnett's multiple comparisons test. Mice fed HF diet with solLB were compared to HF-control2 using a Student’s t-test. *P<0.05, **P<0.01, ***P<0.001.
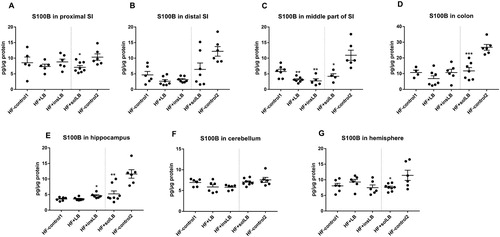
Figure 7 T-maze (A) alternation rate and (B) time spent for making decision of mice fed a HF diet with cellulose for 8 weeks (HF-control1, n=7) or for 2 weeks (HF-control2), or with whole LB (wLB, n=7) or insoluble fraction of LB (insLB, n=7) for 8 weeks, or with soluble fraction of LB (solLB, n=8) for 2 weeks. Data represent mean±SEM. Mice fed HF diets containing wLB or insLB were compared to HF-control1 using one-way ANOVA and Dunnett's multiple comparisons test. Mice fed HF diet with solLB were compared to HF-control2 using a Student’s t-test. No significant difference was detected.
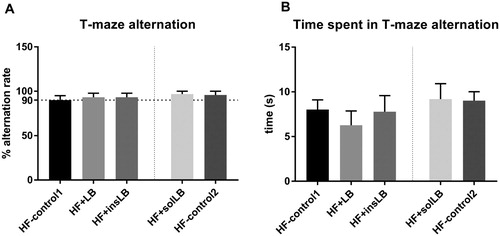
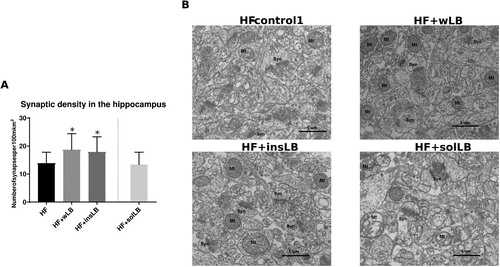
Figure 8 Synaptic density in the CA1 area of the hippocampus of mice fed a HF diet with cellulose for 8 weeks (HF-control1, n=3) or with whole LB (wLB, n=3) or insoluble fraction of LB (insLB, n=3) for 8 weeks, or with soluble fraction of LB (solLB, n=3) for 2 weeks. (A) number of synapses per µm2. (B) Electron microscopic images of the hippocampus, showing synapses (Syn) and mitochondria (Mt). Data in (A) represent mean±SEM. Mice fed HF diets containing wLB or insLB were compared to HF-control1 using one-way ANOVA and Dunnett's multiple comparisons test. No data was obtained from mice fed HF-control2. *P<0.05.