Figures & data
Figure 1. Schematic overview of the experimental protocol and the conducted behavioural tests. The mice received either a control diet or a diet enriched with 3% scGOS:lcFOS (9:1) from the day of birth. The ultrasonic distress vocalization test was conducted during infancy. At 3 weeks of age mice were weaned and the male mice continued the allocated diet of the dam. Grooming behaviour and the marble burying test were performed during adolescence, early adulthood and adulthood and the social interaction test was performed during adulthood. After the last behavioural test organs were collected. USV: ultrasonic distress vocalisation. GB: Grooming behaviour. MB: Marble burying test. SI: Social interaction test.
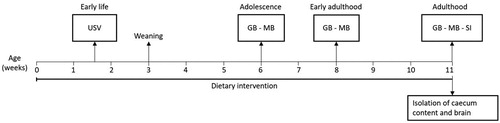
Figure 2. Anxiety-like, repetitive and social behavioural effects of scGOS:lcFOS. (A) scGOS:lcFOS receiving mice emitted significantly less ultrasonic vocalisation calls (USV). (B) Grooming frequency significantly increased over time in both control and scGOS:lcFOS receiving mice (diet: P = 0.08, age: P < 0.000001, interaction: P < 0.05). In adulthood the grooming frequency was significantly lower in the scGOS:lcFOS receiving mice compared with the control mice. (C) The grooming duration was unaffected over time and also unaffected by scGOS:lcFOS (diet: ns, age: ns, interaction: ns). (D) The number of buried marbles was increased across age independent of the dietary supplementation (diet: P < 0.0001, age: P < 0.001, interaction: P > 0.05). In early adulthood and adulthood the scGOS:lcFOS receiving mice buried significantly less marbles compared with control. (E) In the presence of a target mouse the scGOS:lcFOS receiving mice spent more time in the interaction zone compared with control. No differences between the groups in time the mice spent in the zone in absence of target. One scGOS:lcFOS receiving mouse in absence of target and one control mouse in presence of target were excluded as significant outliers (Grubbs test 293 s and 0 s, respectively). (F) The locomotion activity measured by distance moved was decreased in the scGOS:lcFOS receiving mice in both absence and presence of a target mouse. One scGOS:lcFOS receiving mouse in presence of target was excluded as significant outlier (Grubbs test 6200 cm).The data are shown as individually data points, colour indicating the litter, and mean +/− SEM. A-F were analysed with linear mixed models followed by Sidak’s multiple comparison post-hoc test. * P < 0.05, ** P < 0.01, *** P < 0.001, **** P < 0.0001, a=*** compared with adolescence within diet group, b=****** compared with adolescence within diet group, c=* compared with adolescence within diet group, d=** compared with adolescence within diet group, ns = not significant. A: control group n = 11, scGOS:lcFOS group n = 7, B-F: n = 9–10 per group.
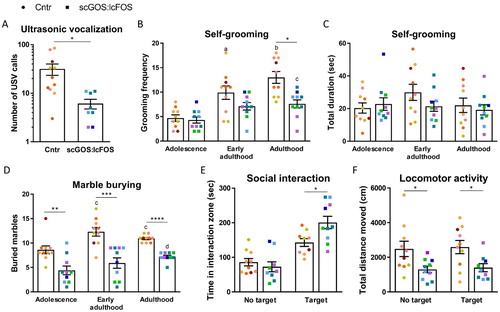
Figure 3. The PFC levels of tryptophan, 5-HT, the 5-HT metabolite 5-HIAA and the serotonin turnover (5-HIAA/5-HT). (A) The tryptophan level was significantly decreased in the scGOS:lcFOS receiving mice. The serotonin level was significantly decreased in the scGOS:lcFOS receiving mice. The 5-HIAA level and the serotonin turnover were not significantly different. The tryptophan levels and the serotonin levels (B) as well as the 5-HT and the 5-HIAA levels (C) correlated significantly. (A) Data shown as individually data points and mean +/− SEM. A: Analysed by student t-test; (B,C) analysed by spearman correlation. * P < 0.05. A–C: n = 5 per group. TRP: tryptophan, 5-HT: 5-hydroxytryptamine (serotonin), 5-HIAA: 5-hydroxyindolacetic acid.
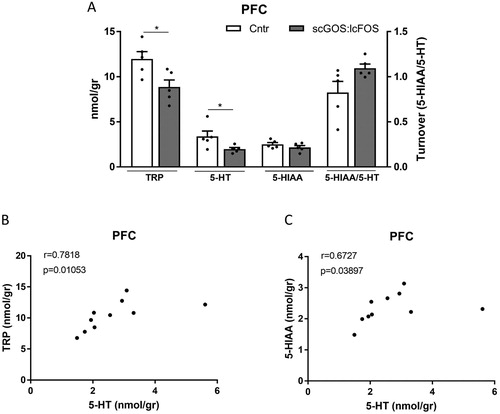
Figure 4. The SSC levels of tryptophan, 5-HT, the 5-HT metabolite 5-HIAA and the serotonin turnover (5-HIAA/5-HT). (A) The tryptophan, 5-HT and 5-HIAA levels were not significantly different between the scGOS:lcFOS and control diet receiving mice. The serotonin turnover was significantly increased in the scGOS:lcFOS receiving mice. The tryptophan and the 5-HT levels (B) as well as the 5-HT and the 5-HIAA levels (C) did not correlate. (A) Data shown as individually data points and mean +/− SEM. A: Analysed by student t-test; (B,C): Analysed by spearman correlation. * P < 0.05. A: n = 10 per group; (B, C) n = 10. TRP: tryptophan, 5-HT: 5-hydroxytryptamine (serotonin), 5-HIAA: 5-hydroxyindolacetic acid.
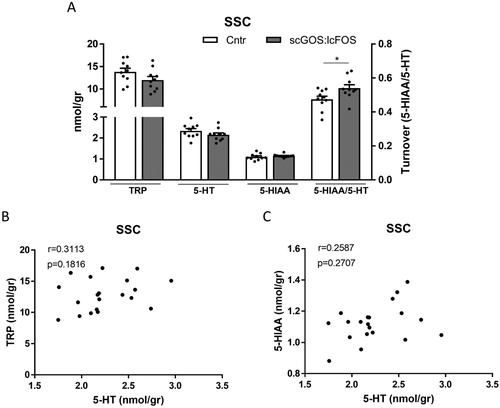
Figure 5. The mRNA expression of Htr1a, Htr1b, Tph2 and Bdnf in the PFC and SSC. (A) In the PFC the mRNA expression of 5ht1a was significantly decreased in the scGOS:lcFOS receiving mice. The Htr1b (B) and Tph2 (C) mRNA expressions were unchanged. The mRNA expression of Bdnf was significantly increased in the scGOS:lcFOS receiving mice (D). In the SSC the mRNA expression of Htr1a trended towards a decrease in the scGOS:lcFOS group (E). The Htr1b (F), Tph2 (G) and Bdnf (H) mRNA expression was not significantly changed between the groups. A-H: Data shown as individually data points and mean +/− SEM. A-H: Analysed by student t-test. * P < 0.05, ** P < 0.01. (A–H) n = 3–5 per group. PFC: prefrontal cortex, SSC: somatosensory cortex, Htr1a: serotonin receptor 1a, Htr1b: serotonin 1b receptor, Tph2: tryptophan hydroxylase 2, Bdnf: Brain derived neurotrophic factor.
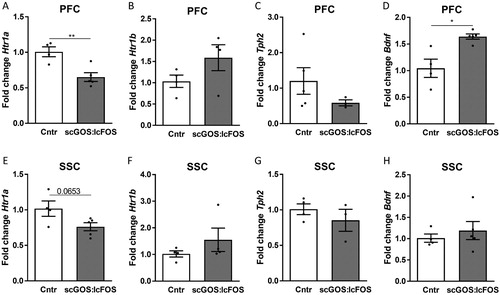
Figure 6. Caecal SCFA. The levels of the SCFAs acetic (A), propionic (B) and butyric (C) acids were significantly increased in the scGOS:lcFOS group. (D) The level of valeric acid was unaffected by scGOS:lcFOS and the levels of the branched SCFA iso-valeric acid (E) and iso-butyric acid (F) were significantly decreased in the scGOS:lcFOS group. (A–F) Data shown as individually data points and mean +/− SEM. A-F: Analysed by student t-test. * P < 0.05, ** P < 0.01, *** P < 0.001, **** P < 0.0001. (A–F): n = 10 per group. SCFA: short-chain fatty acids.
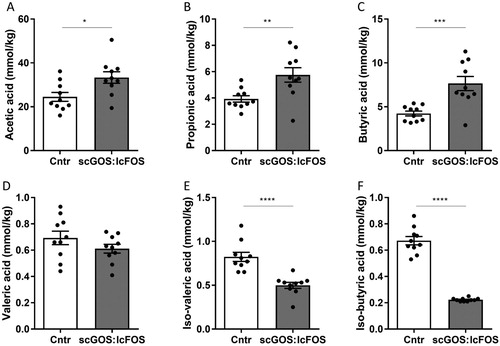
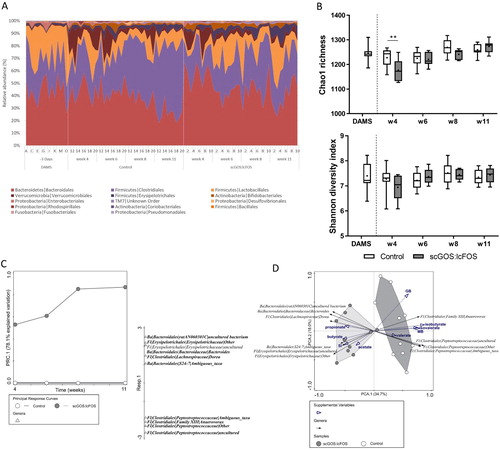
Figure 7. Faecal microbiota. (A) Taxa composition of each mouse per group and age at the bacterial phylum and order level. Only taxa with a relative abundance > 0.1% on average (based on number of reads per total reads) are plotted in the stacked area chart. Sorted from largest to smallest relative abundance. (B) Chao1 richness and Shannon species diversity plotted as box plots with whiskers showing the range, boxes the interquartile range and the line at median. The ‘+’ shows the average Chao1 and Shannon index per group and age. Statistics performed with two-way ANOVA with Sidak’s multiple comparisons test comparing scGOS:lcFOS with control per timepoint (** P < 0.01). Rarefaction depth used for summary of diversity: 27,242 reads per sample. (C) PRC with the top 10 responding bacterial genera for treatment over time with adjustment for age. The treatments are presented as a single response curves over time (on the horizontal axis) with the control-group as reference with zero PRC values (on the vertical axis) and so its curve lays over the horizontal axis. The top 10 bacterial genera are plotted on the separate vertical (one-dimensional) plot based on best fit with the first PRC axis. Monte Carlo Permutation Test (MCPT) with 1,000 permutations showed a significant interaction (P = 0.001) of treatment with time on the 1st PRC axis (78.1% explained variation). Differential abundance testing was performed with the metagenomeSeq-package on the top 10 identified bacterial taxa. The taxa that were confirmed to be significantly different at 2 or more timepoints (with correction for multiple testing by false discovery rate < 0.1) are shown in bold. The bacterial genera are detailed at the phylum level (Ba = Bacteroidetes, Fi = Firmicutes), the order, family and genus level. (D) PCA tri-plot of faecal microbiota composition of all mice in adulthood coloured by membership to the scGOS:lcFOS diet group and control group, respectively. Individual samples (dots) are plotted on the first two axes of the PCA-analysis with more similar compositions closer to each other. The bacterial genera that were identified from the PRC analysis (the top 10) are plotted as the black biplot arrows. The behavioural readouts and the SCFAs are supplemented as blue biplot arrows to visualize the correlations in adulthood. The bacterial genera are detailed at the phylum level (Ba = Bacteroidetes, Fi = Firmicutes), the order, family and genus level. PRC: Principal Response Curve, PCA: Principal Component Analysis, SI: Social Interaction, seconds in interaction zone in presence of target, MB: Number of buried marbles, GB: Grooming frequency.