Figures & data
Figure 1. Timeline of experiments. During the adolescent period of development, rats were exposed to either a junk food-style cafeteria diet (top) or an otherwise healthy diet with access to a sugar-sweetened beverage (bottom). Metabolic, cognitive, and gut microbiome outcomes were evaluated either before (Experiments 1A and 2A) or after (Experiments 1B and 2B) a healthy dietary intervention (access to standard chow and water only) during early adulthood. PN: postnatal day; CAF: cafeteria diet; SUG: sugar diet; NOIC: novel object in context; NMR: nuclear magnetic resonance imaging spectroscopy; IPGTT: intraperitoneal glucose tolerance test.
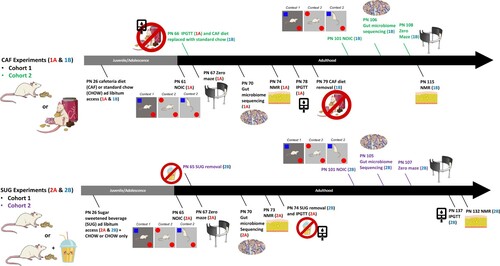
Figure 2. Energy balance and metabolic outcomes following adolescent cafeteria diet consumption. There were no overall significant group differences in body weight (A), total caloric intake (B), or glucose tolerance in the IPGTT test (C and D). Rats in the CAF group consumed significantly fewer calories following the healthy dietary intervention (B). CAF-exposed rats had significantly greater adiposity than CHOW rats (E). Percent total calories from each food item in the CAF diet as well as % macronutrient composition of total calories consumed in Cohort 1 are depicted in (F). Data are means ± SEM; n = 10/group, **P < 0.01. CHOW: chow-fed; CAF: cafeteria diet; kcal: kilocalories; IPGTT: intraperitoneal glucose tolerance test.
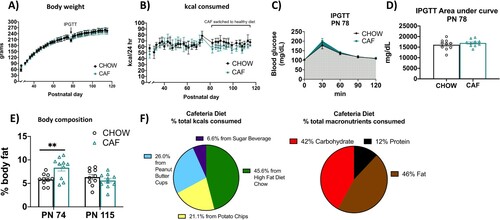
Figure 3. Energy balance and metabolic outcomes following adolescent sugar diet consumption. There were no overall significant group differences in body weight (A) or total caloric intake (B), although rats in the SUG group consumed less calories from chow (C) when consuming the sugar solution (D). The SUG group had significantly higher blood glucose levels (E and G) and adiposity (H) relative to CHOW rats, which normalized after healthy dietary intervention (F, G and H). Data are means ± SEM; n = 16/group before sugar removal (PN 74), n = 8/group after sugar removal (PN 75+) *P < 0.05, **P < 0.01. CHOW: chow-fed; SUG: sugar; kcal: kilocalories; IPGTT: intraperitoneal glucose tolerance test.
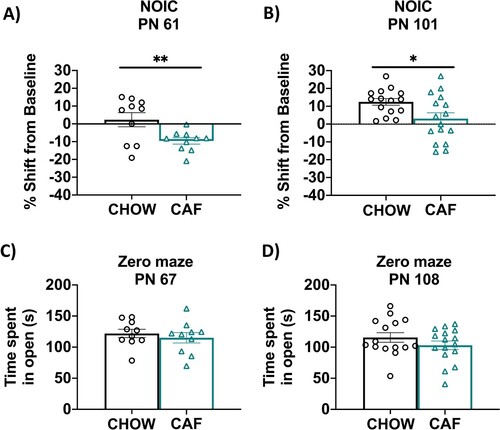
Figure 4. Hippocampal-dependent memory following adolescent cafeteria diet consumption. CAF-exposed rats were impaired in the NOIC memory task (calculated as shift from baseline discrimination index on test day) when tested either before (A) or after (B) a healthy dietary intervention. There were no significant group differences in anxiety-like behavior in the Zero Maze when tested either before (C) or after (D) a dietary intervention. Data are means ± SEM; A/C: n = 10/group, B/D: n =15/CHOW group, n = 16/CAF group, *P < 0.05, **P < 0.01. CHOW: chow-fed; CAF: cafeteria diet; NOIC = novel object in context.
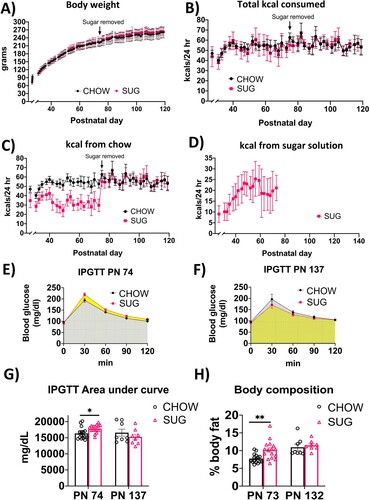
Figure 5. Hippocampal-dependent memory following adolescent sugar diet consumption. SUG-exposed rats were impaired in the NOIC memory task (calculated as shift from baseline discrimination index on test day) when tested before (A), but not after (B) a healthy dietary intervention. There were no significant group differences in anxiety-like behavior in the Zero Maze when tested either before (C) or after (D) the dietary intervention. Data are means ± SEM; A/C: n = 16/group, B/D: n = 9/group *P < 0.05. CHOW: chow-fed; SUG: sugar; NOIC: novel object in context.
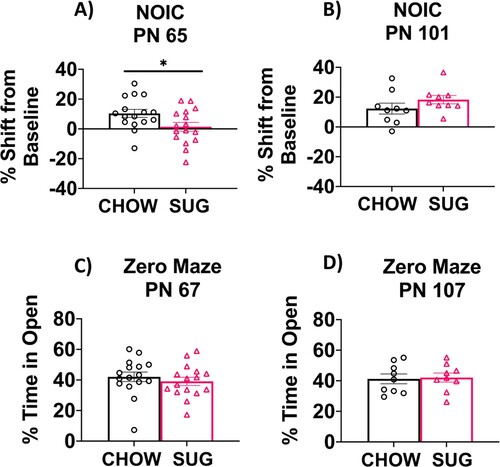
Figure 6. Gut microbiome following adolescent cafeteria diet consumption. (A and B) PCoA plots of CAF-exposed rats gut microbiomes when analyzed either in Experiment 1A (no healthy dietary intervention) or in Experiment 1B (after healthy dietary intervention). Ellipses indicate 95% confidence limits. R2 and P are from PERMANOVA tests. (C) Shannon index of CAF-exposed rats gut microbiomes either before or after healthy dietary intervention. The differences were tested with Wilcoxon tests. (D and E) Significant differential taxa between treatment and chow-fed rats at phylum to species level (Wilcoxon test, FDR<0.1) are highlighted on the phylogenetic trees of all taxa identified in this study. An FDR cutoff of 0.1 was used here for visualization. (F) The correlation plots of Deferribacteraceae in Experiment 1A, Proteobacteria, Actinobacteria (phylum), Cyanobacteria and Ruminiclostridium in Experiment 1B with NOIC performance (% shift from baseline discrimination index on test day) across CAF and CHOW samples. Spearman’s correlation was used for the analysis and P-values were corrected for multiple hypotheses testing with the Benjamini-Hochberg method. CHOW: chow-fed; CAF: cafeteria diet; PCoA: Principal Coordinate Analysis; FDR: false discovery rate; rho: Spearman’s ρ.
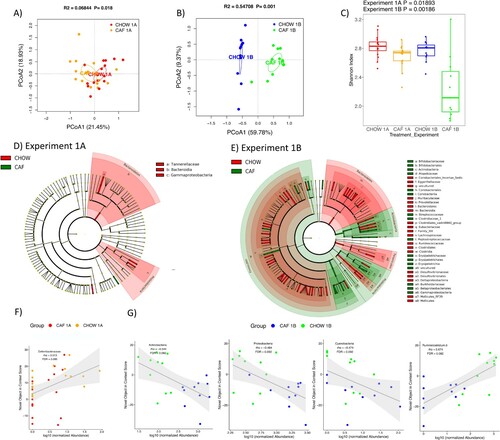
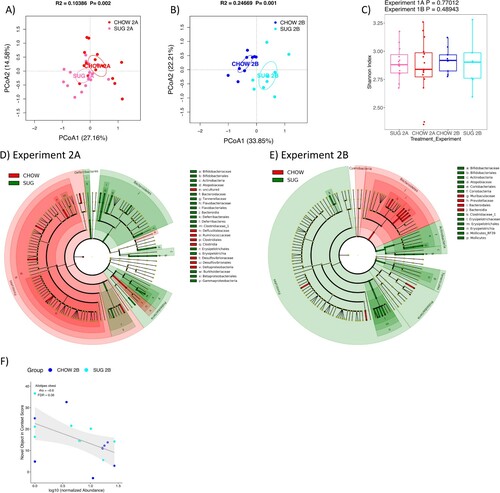
Figure 7. Gut microbiome following adolescent sugar diet consumption. (A and B) PCoA plots of SUG-exposed rats gut microbiomes when analyzed either before (A) or after (B) a healthy dietary intervention. Ellipses indicate 95% confidence limits. R2 and P are from PERMANOVA tests. (C) Shannon index of SUG-exposed rats gut microbiomes when analyzed either before or after a healthy dietary intervention. The differences were tested with Wilcoxon tests. (D and E) Significant differential taxa between treatment and CHOW at phylum to species level (Wilcoxon test, FDR<0.1) are highlighted on the phylogenetic trees of all taxa identified in this study. An FDR cutoff of 0.1 was used here for visualization. (F) The correlations plots of Alistipes obesi with NOIC performance (% shift from baseline discrimination index on test day) in Experiment 2B. Spearman’s correlation was used for the analysis and P-values were corrected for multiple hypotheses testing with the Benjamini-Hochberg method. CHOW: chow-fed; SUG: sugar; PCoA: Principal Coordinate Analysis; FDR: false discovery rate; rho: Spearman’s ρ.