
Figures & data
Figure 1. Timeline of the study. Female C57Bl/6 mice (n = 90) were ovariectomized (OVX) then randomized to 1 of 5 diets on Day 0. Chemotherapy and saline injections were given on day 14 and 28. Mice were sacrificed, and tissues were collected on day 35.
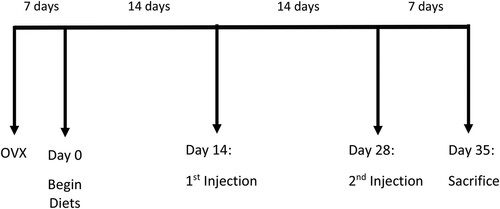
Figure 2 Brain n-3 and n-6 PUFA levels as percent of total fatty acids (Mean +/− SEM) measured by gas chromatography from n = 90 mice at sacrifice after 5 weeks of diets and 2 injections. (a) EPA (b) DHA (c) LA and (d) AA. a depicts differences (p < 0.05) between High E + D diets compared to High ALA and control diets. * depicts differences (p < 0.05) between chemotherapy compared to control saline injection. LS = Low Sucrose, HS = High Sucrose, High E + D = 2% kcals from EPA + DHA, High ALA = 1.3% kcals ALA, Control = Low ALA (0.6% kcals)/Low Sucrose, Eicosapentaenoic acid (EPA), docosahexaenoic acid (DHA), linoleic acid (LA), arachidonic acid (AA), polyunsaturated fatty acids (PUFA)
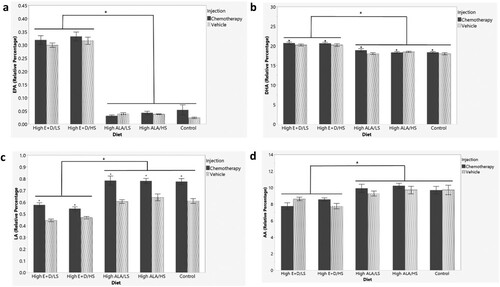
Figure 3. Liver PUFA levels as percent of total fatty acids (mean +/- SEM) measured via gas chromatography in a sub-cohort of 50 mice. (a) EPA (b) DHA (c) LA (d) AA. a depicts differences (p < 0.05) between High E + D and the high ALA and control diets. # depicts differences (p < 0.05) between control diet and a High ALA diet. ^ depicts differences (p < 0.05) between High E + D/LS and High E + D/HS diets. * depicts differences (p < 0.05) between chemotherapy and control saline injection. + depicts differences (p < 0.05) between High ALA/LS and High ALA/HS diets. Eicosapentaenoic acid (EPA), docosahexaenoic acid (DHA), linoleic acid (LA), arachidonic acid (AA), alpha-linolenic acid (ALA), polyunsaturated fatty acids (PUFA). LS = Low Sucrose, HS = High Sucrose, High E + D = 2% kcals from EPA + DHA, High ALA = 1.3% kcals ALA, Control = Low ALA (0.6% kcals)/Low Sucrose.
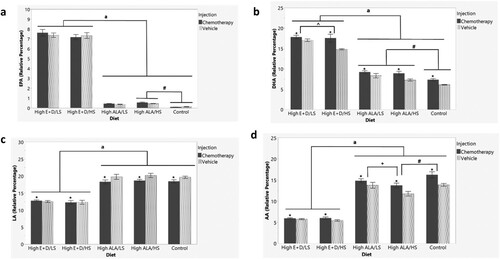
Table 1. Pearson correlations for brain and liver PUFAs (n = 50 mice; 4–6 per diet and injection group). Results adjusted for multiple comparisons using Bonferroni’s correction; p < 0.006 considered significant. PUFA = polyunsaturated fatty acid, LA = linoleic acid, AA = arachidonic acid, EPA = eicosapentaenoic acid, DHA = docosahexaenoic acid.
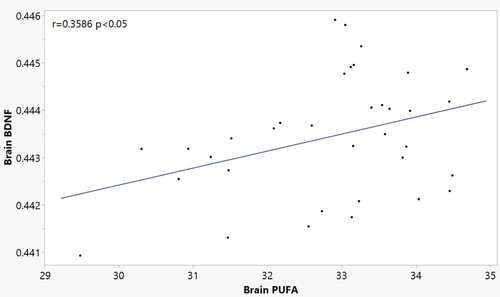
Figure 4. Pearson correlation of total brain PUFA content and Brain BDNF in n = 34 mice (3–4 per diet/injection group) at sacrifice. (r = 0.3586 p < 0.05).
Supplemental Material
Download MS Word (1.1 MB)Data availability statement
All data discussed in this article is available through contacting the corresponding author Dr. Tonya Orchard.