
Figures & data
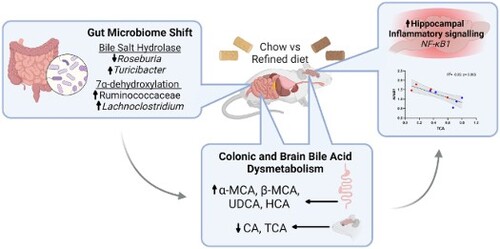
Figure 1. Composition of chow and rLFD.
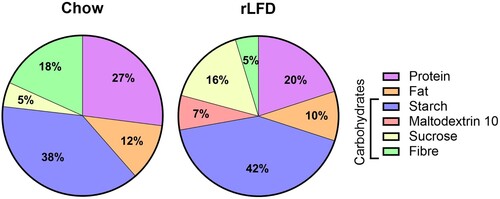
Figure 2. rLFD significantly modulates the gut microbiome diversity and composition. (A) Alpha diversity using Chao1, Simpson’s index, and the number of observed species was decreased in a rLFD compared to chow (p < 0.05). Shannon index was decreased near significance (p = 0.06). (B) Beta diversity measured through ANOSIM showed significant separation between the two groups. (C) Linear discrimination analysis (LDA) effect size (LEfSe) of significant differences (FDR adjusted p < 0.05) in genera between rLFD and standard chow diet. (D) abundance of gut microbiota genera with bile salt hydrolase capability modulated by rLFD. (E) abundance of gut microbiota family Rumminococcaceae and genera Lachnoclostridium, with 7α-dehydroxylation capability. * = p < 0.05, ** = p < 0.01.
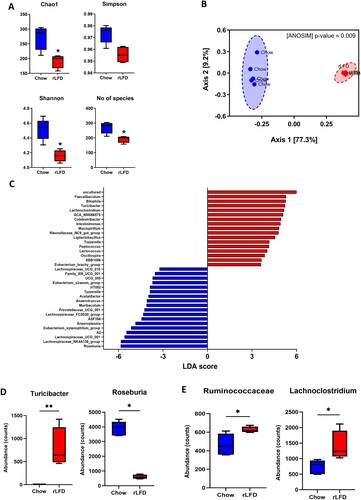
Figure 3. rLFD altered the metabolomic profile. (A) Partial least squares-discriminant analysis (PLS-DA) showed separation between rLFD and chow diet, indicative of a metabolic shift in response. (B) Heatmap depicting changes in each metabolite in chow and rLFD diet. (C) rLFD significantly modulates short-chain fatty acid concentrations, including a decrease in acetate, propionate, n-butyrate and an increase in i-butyrate. *** = p < 0.001.
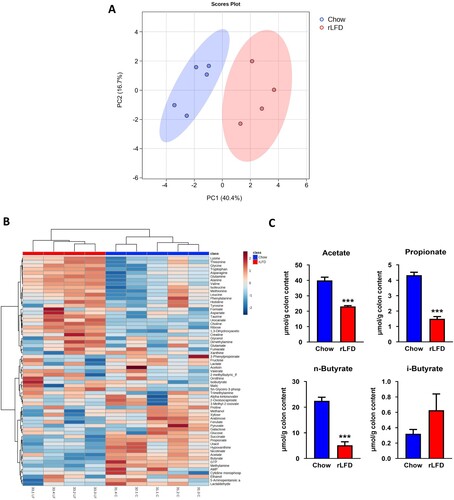
Figure 4. The gut microbiome and the metabolome profile of chow and rLFD mice are significantly related. (A) Procrustes plot comparing the relationship between the microbiome and the metabolome profiles. Longer lines indicate more within-subject dissimilarity. (B) Spearman rank correlation showing the interaction between microbiota genus and metabolome that are significantly modulated by the rLFD. (C) Heatmap displaying Spearman rank correlation between bile acids in the colon and gut microbiome genera. * = p < 0.05. Red = positive correlation. Blue = negative correlation.
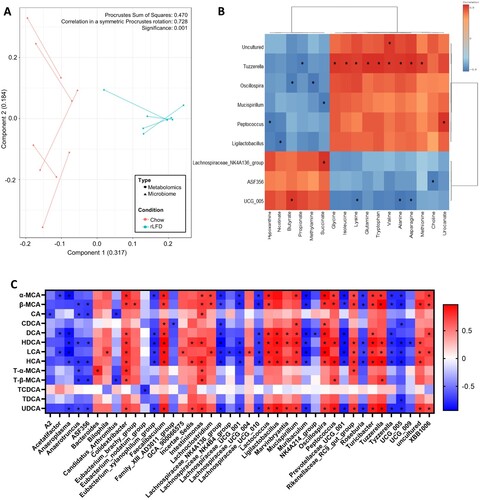
Figure 5. Bile acid profiles in both the colon and brain are modulated by a rLFD. Bar plots represent the concentration of bile acids (µg/g) in the colon (A) and the brain (B). The blue bars represent the standard chow diet (n = 5), the red bars represent the rLFD diet (n = 5). Error bars = SEM. * = p < 0.05, ** = p < 0.01.
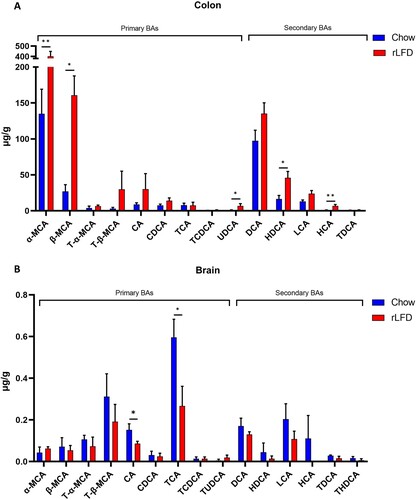
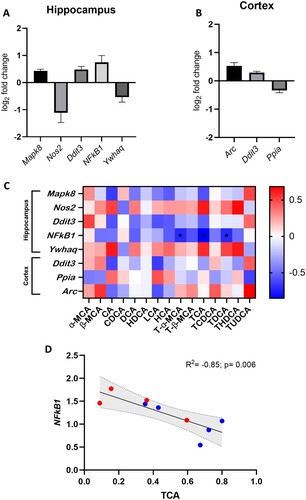
Figure 6. rLFD significantly modulates gene expression in the hippocampus and cortex. Significant log2 fold changes in mRNA expression in a rLFD (n = 5) in comparison to a chow (n = 5) diet in the hippocampus (A) and the cortex (B) (p < 0.05). (C) Heatmap displaying Spearman rank correlation between genes significantly modulated by rLFD and bile acids in the brain. * = p < 0.05. (D) TCA concentration in the brain is significantly modulated by rLFD and is correlated with NF-κB1 signalling in the hippocampus. Blue = chow diet. Red = rLFD. Shaded region displays 95% confidence interval.
Connell et al_Supplementary information rev1.docx
Download MS Word (62.4 KB)Connell et al_Supplementary information rev1_anonymous.docx
Download MS Word (61.5 KB)Data availability statement
The data that support the findings of this study are available on request from the corresponding author.