
Figures & data
Table 1. Composition of standard rodent laboratory diet (standard normal-protein (NP) diet, 17% and low-protein (LP) diet, 6% (AIN 93G)).
Figure 1. The figure depicts body mass (in g) (panel A) and anogenital distance (at birth) (panel B), the body mass at birth, 7-days old, and 14-days old offspring with regular protein intake (NP, n = 20 for each age from different mothers) compared with age-matched low protein intake (LP, n = 20 for each age from different mothers) progeny (in grams) (panel C), and the basal corticosterone plasma level (in ng/ml) (panel D) at 7-days old and 14-days old offspring (n = 6 for each age) compared with the age-matched regular protein diet (NP) (n = 6 for each age) offspring. One offspring from each litter was used for hormonal analysis. The results are expressed as means ± SD. Data obtained over time were analyzed using repeated-measures analysis of variance (ANOVA). When ANOVA indicated statistically significant differences between selected standards, post hoc comparisons were performed with Bonferroni’s contrast test. Comparisons involving two means within or between groups were conducted using a Student’s t-test. The level of significance was set at *P < 0.05.
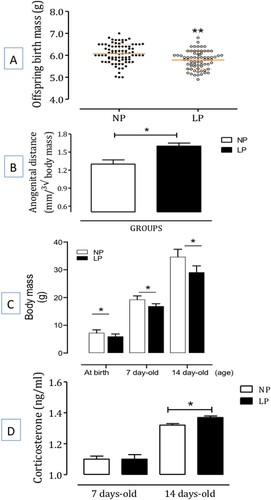
Figure 2. Effect of gestational protein restriction on the brainstem, thymus, and adrenal masses (in grams per 100 g body weight) in male offspring from protein-restricted (LP, n = 10 for each age from different mothers) and from normal-diet (NP, n = 10 for each age from different mothers) intake dams during the whole gestation. The results are expressed as means ± SD. Data obtained over time were analyzed using repeated-measures analysis of variance (ANOVA). When statistically significant differences were indicated between selected means by ANOVA, post hoc comparisons were performed with Bonferroni’s contrast test. The level of significance was set at *P < 0.05.
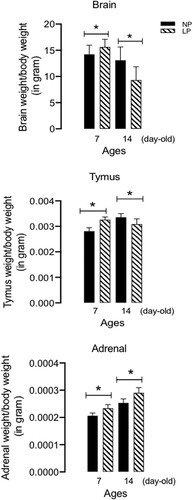
Figure 3. Effect of gestational protein restriction on the volume (panels A, B) and total cells (panels C, D) of anterodorsal and anteroventral BNST divisions (n = 4 for each age from different experimental group), and the neuron, non-neuron, and total cell number in BNST from maternal protein-restricted (LP, n = 7 for each age) compared to normal-diet intake (NP, n = 7 for each age) male offspring. The results are expressed as means ± SD. Data obtained over time were analyzed using repeated-measures analysis of variance (ANOVA). When ANOVA indicated statistically significant differences between selected standards, post hoc comparisons were performed with Bonferroni's contrast test. The level of significance was set at *P < 0.05.
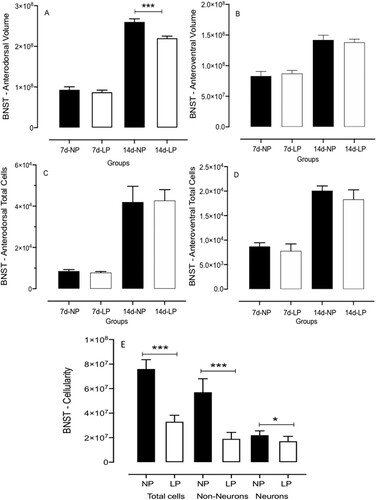
Figure 4. The graphic depicts the dendritic length of BNST neurons from maternal protein-restricted (LP, n = 4) compared to normal-diet intake (NP, n = 4) male offspring. Data expressed as mean ± SD. A representative BNST neuron micrograph is shown. The intersections and length of the dendritic tree between two progressive circles are positioned at intervals of 10 μm radial and 30 μm from perikaryon. The graphic is shown from Sholl's analysis. One offspring from each litter was used for histological analysis. Statistical analysis of segmental dendritic plots was conducted using repeated measures analysis of variance with adequate Greenhouse–Geisser corrections on the significant values. The level of significance was set at *P < 0.05.
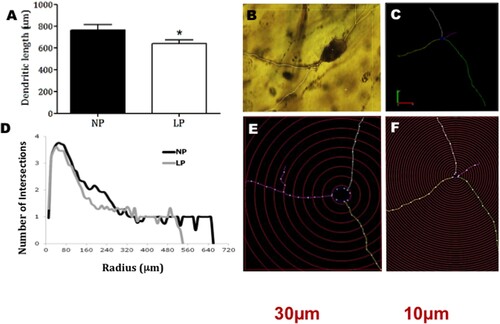
Figure 5. Effects of gestational protein restriction (LP, n = 6 for each age from different mothers) compared to NP progeny (n = 6 for each age from other mothers) on BNST catecholamine and serotonin levels determined by High-Performance Liquid Chromatography (HPLC). This figure shows the results obtained in whole-tissue extracts for NEP, EPI, DOPA, and DOPAC in 7-day-old and 14-day-old NP and LP offspring. The results are expressed as ng/mg of BNST protein. Columns and bars represent the mean ± SD *P < 0.05 vs. NP (analysis of variance (ANOVA); post hoc Bonferroni's test).
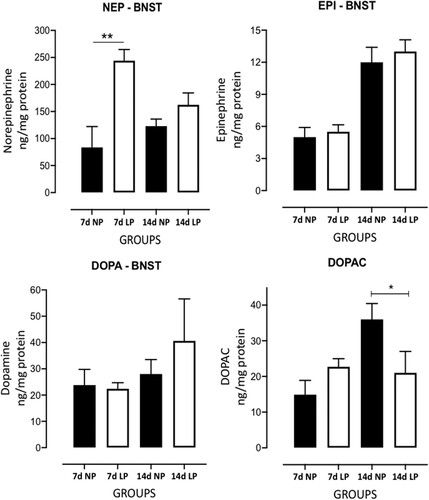
Figure 6. Effects of gestational protein restriction (LP, n = 6 for each age from different mothers) compared to NP progeny (n = 6 for each age from different mothers) on BNST catecholamine and serotonin levels determined by High-Performance Liquid Chromatography (HPLC). This figure shows the results obtained in whole-tissue extracts for 5-HT, 5-HIAA, 5-HT turnover and DOPA turnover in 7-day-old and 14-day-old NP and LP offspring. The results are expressed as ng/mg of BNST protein and turnovers by the ratio between DOPAC/DOPA and 5-HIAA/5-HT. Columns and bars represent the mean ± SD *P < 0.05 vs. NP (analysis of variance (ANOVA); post hoc Bonferroni's test).
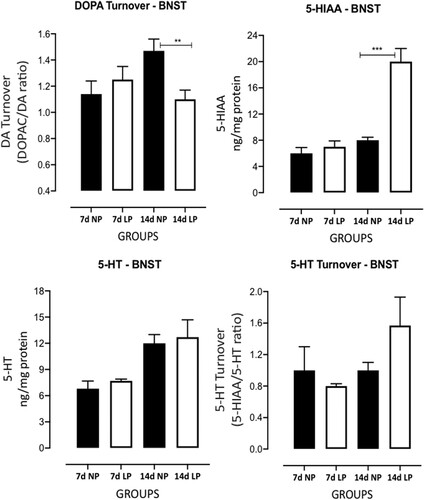
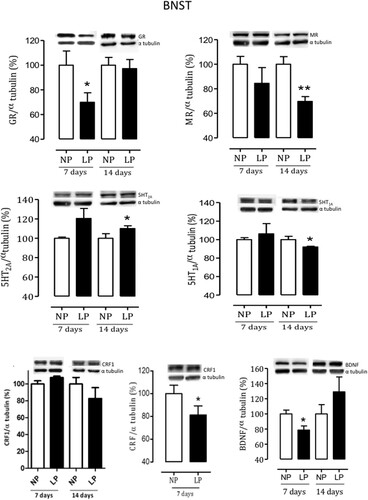
Figure 7. Effects of gestational protein restriction on expression of BNST proteins. shows the results obtained in whole-tissue extracts immunoblotted for GR, MR, 5HT1a, 5HT2a, CRF, type 1 CRF receptor, and BDNF in the NP and age-matched LP male offspring BNST. The representative results of scanning densitometry were expressed as relative to NP, assigning a value of 100% to the control (NP) rats. Columns and bars represent the mean ± SD. Data obtained over time were analyzed using repeated-measures analysis of variance (ANOVA). When statistically significant differences were indicated between selected means by ANOVA, post hoc comparisons were performed with Bonferroni’s contrast test. The level of significance was set at *P < 0.05, NP versus LP progeny.
Data availability statement
https://acervus.unicamp.br/index.html (DOI: https://doi.org/10.47749/T/UNICAMP.2016.971693). http://repositorio.unicamp.br/acervo/detalhe/971693?guid = 1684785483168&returnUrl=%2fresultado%2flistar%3fguid%3d1684785483168%26quantidadePaginas%3d1%26codigoRegistro%3d971693%23971693&i = 1, and https://www.tandfonline.com/doi/abs/10.1080/1028415X.2022.2131064?journalCode = ynns20.