
Figures & data
Figure 1. Directed acyclic graph of factors affecting incumbent voting. z1 and z2 represent observed and unobserved causes of respondent and incumbent position on same-sex marriage; z3 observed and unobserved causes of area attitudes.
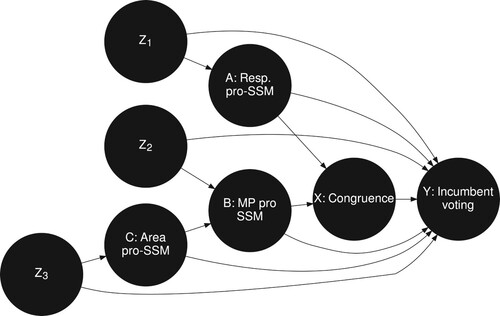
Table 1. Logistic regression models of incumbent voting. Models shown for first-preference and two-party preferred vote, with and without controls.
Figure 2. Change in the vote share for Coalition incumbents as a function of local support for same-sex marriage and MP stance. Plotted points are scaled in proportion to the number of citizens in each polling place catchment area.
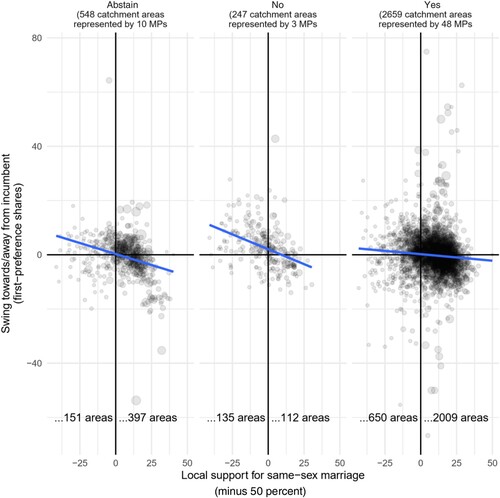
Table 2. Multilevel linear regression models of incumbent voting. Models shown for first-preference and two-party preferred vote, with and without controls.
Table 3. Multilevel linear regression models of incumbent vote share. Models shown without and with controls.