
Figures & data
Figure 1. Flow diagram showing the number of participants eligible for and included in the two analytical samples.
Figure 2. Average raw cognition scores across the study period. Standard deviations are shown with light blue error bars. Total possible scores range from 0 to 100, as they are average of the percent of maximum possible scores on the three relevant tests (memory: immediate recall, delayed recall, digit ordering; EF/language: similarities, letter fluency, category fluency).
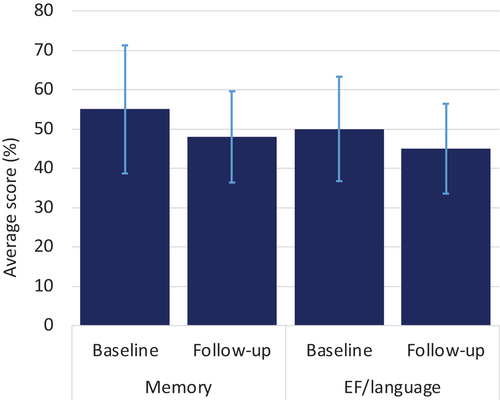
Table 1. Characteristics of the samples for each outcome at baseline.
Table 2. Associations between arts engagement and the two cognition outcomes using inverse probability of treatment weighting.
Supplemental Material
Download MS Word (347.4 KB)Data availability statement
The data that support the findings of this study are openly available from the Wisconsin Longitudinal Study (WLS) website at https://www.ssc.wisc.edu/wlsresearch/data/.