
Figures & data
Figure 1. Map of Harsha Lake near Cincinnati, Ohio with sampling scheme implemented on June 27th, 2014 in order to acquire water quality information from 44 sites within 1 h of image acquisition.
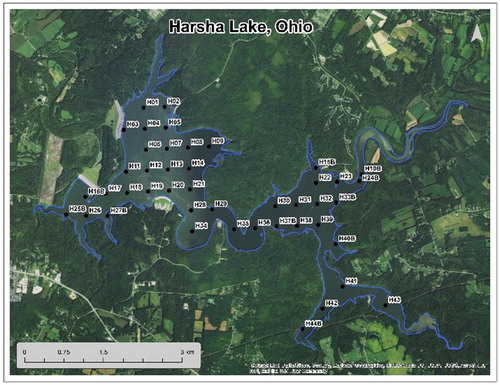
Figure 2. Averaged ASD surface relative reflectance spectra (red line) vs. Averaged CASI reflectance spectra (N = 16) (dotted blue line) for Harsha Lake with CASI data normalized to ASD at 550 nm. Wavelength in nm. They correspond well over the 425 and 865 nm wavelength range used in our study. One can even see a slight depression in the CASI spectra at 620 nm that corresponds to the phycocyanin absorption feature.
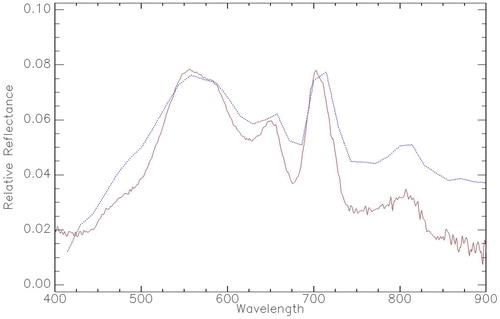
Figure 3. Averaged ASD surface relative reflectance spectra (red line) resampled to the same wavelengths as our CASI data vs. Averaged CASI reflectance spectra (N = 16) (dotted blue line) for Harsha Lake with CASI data normalized to ASD at 550 nm. Wavelength in nm.
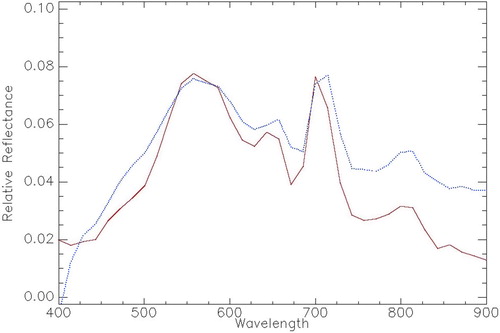
Figure 4. Pearson’s test of linear correlation for ASD vs. CASI relative reflectance values at 32 wavelengths (n = 32). r2 = 0.89, p < 0.001, degrees of freedom = 30, slope = 1.265, intercept = -0.024.
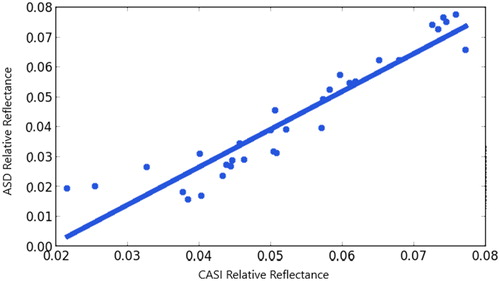
Table 1. Harsha Lake summary statistics for the 29 water quality sampling locations collected from the YSI water sonde and water grab surface measurements.
Table 2. Sensor configurations for the future HABSat-1 and the hyperspectral derived synthetic HABSat-1
Table 3. HABSat-1 algorithm calculations and evaluation against in situ surface observation of YSI sonde derived chlorophyll-a values for all 29 surface water observations (Global Model), and the average of the 15 k-folds models Cross-Validated Average).
Table 4. HABSat-1 algorithm calculations and evaluation against in situ surface observation of YSI sonde derived BGA/PC units for all 29 surface water observations (Global Model), and the average of the 15 k-folds models (Cross-Validated Average).
Table 5. HABSat-1 algorithm calculations and evaluation against surface water grab derived SUMReCHL units for all 29 surface water observations (Global Model), and the average of the 15 k-folds models (Cross-Validated Average).
Figure 5. Results of the best performing Chl-a algorithm, CI324, with darker pixels indicating higher Chl-a concentrations. Pearson's r2 = 0.81 of and a RMSE of 2.587.
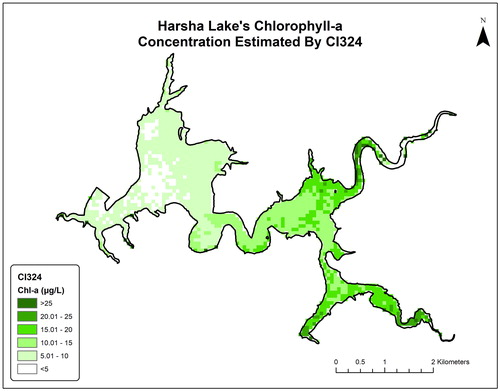
Figure 6. Results of the best performing PC algorithm, 2B4D1, with darker pixels indicating higher PC concentrations. Pearson's r2 = 0.844 of and a RMSE of 2.07.
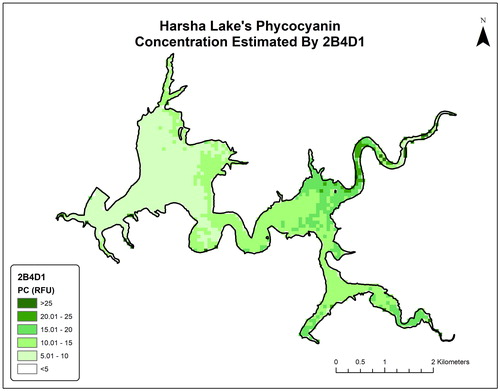
Table 6. Algae taxonomy of Harsha Lake measured in average relative abundance by algae divisions.