Figures & data
Figure 1. Locations of confirmed cyanobacterial blooms (CCBR) reported to the Ministry of the Environment, Conservation and Parks between 1994 and 2019 (blue dots) across the province of Ontario. Colored areas display ecoregion, and black lines represent freeways and highways (Ontario Road Network Citation2018).
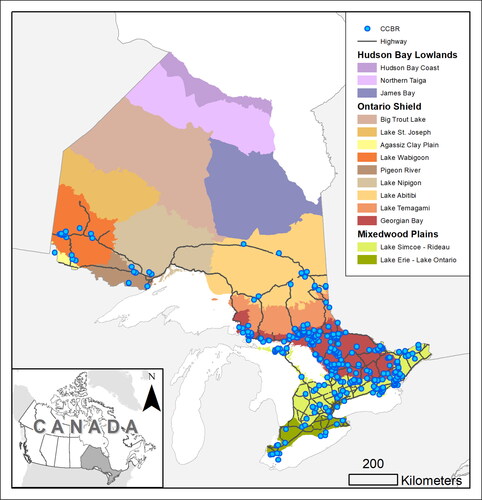
Figure 7. Number of samples each month between 1994 and 2019 in which a taxon was a dominant or co-dominant cyanobacterial bloom contributor, separated by the type of sampling location. Counts include second sampling on rare occasions when blooms persisted multiple weeks. Panels are (A) Dolichospermum (sensu lato), (B) Microcystis, and (C) Aphanizomenon, the 3 most commonly observed cyanobacteria taxa in this study. Samples may be counted in multiple columns because taxa can be co-dominant.
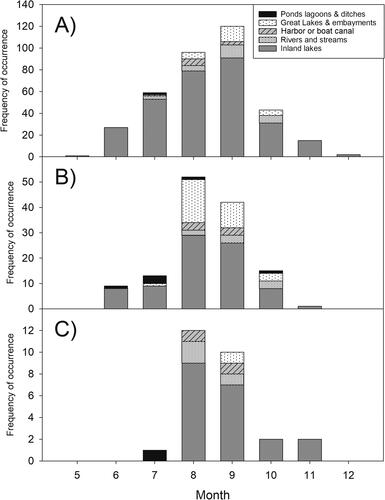
Figure 2. Variation among the ecoregions of Ontario in mean spring total phosphorus (TP) in inland lakes and rivers. Ecoregions with fewer than 10 waterbodies with Lake Partner Program water chemistry data are not shown.
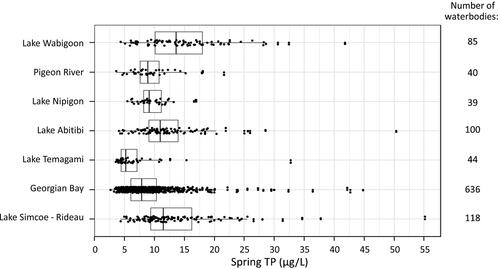
Figure 3. (A) Number of confirmed cyanobacterial blooms reported by the public to the Ontario Ministry of the Environment, Conservation and Parks and (B) number of waterbodies reporting first confirmed cyanobacterial blooms by year between 1994 and 2019. The shaded area represents the period of data that was included in Winter et al. (Citation2011). The vertical line represents the introduction of the provincial response protocol for algal blooms in 2006, which may have altered the number of confirmed cyanobacterial bloom reports, although the magnitude of the effect cannot be ascertained. Annual totals exclude reports from drainage ditches, artificial ponds, semi-enclosed harbors, and non-naturalized reservoirs.
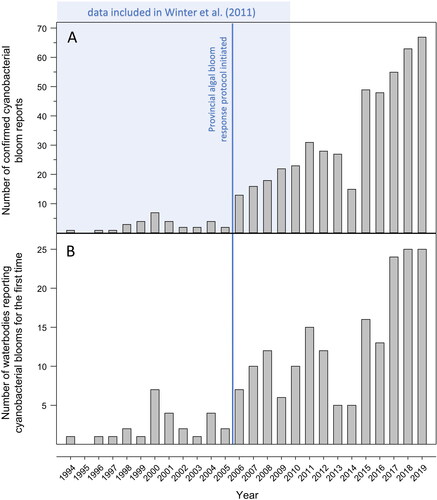
Figure 4. Comparison of mean spring total phosphorus (TP) concentrations between 2 time periods (2005–2009 and 2015–2019) observed in inland lakes and rivers from the Ontario Lake Partner Program (Ontario Ministry of the Environment, Conservation and Parks Citation2022a) that had at least 2 years of sampling in each time period. A comparison of matched pairs using a Wilcoxon signed-rank test (Wilcoxon Citation1945) indicated that spring TP concentrations decreased significantly between these 2 time periods (results shown in top left corner). A one-to-one line indicating no change between time periods is shown for reference; points below the line (n = 231) showed a decrease in average spring TP, whereas points above the line (n = 173) demonstrated an increase.
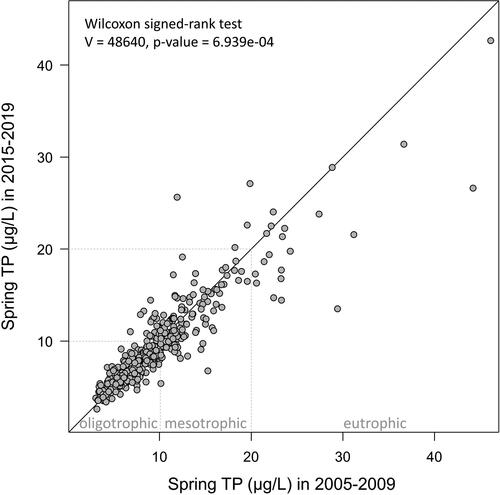
Figure 5. Comparison of mean spring total phosphorus (TP) concentrations in inland lakes and rivers that have had no confirmed cyanobacterial bloom reports (CCBRs), with those that have had 1–2 or 3 or more years with CCBRs within the Georgian Bay and Lake Simcoe–Rideau ecoregions. The numbers of waterbodies included in each category are displayed above the plots. The area within each violin plot is scaled to the number of observations (waterbodies), with black horizontal lines representing quartiles, and black dots indicating mean TP concentration for each category.
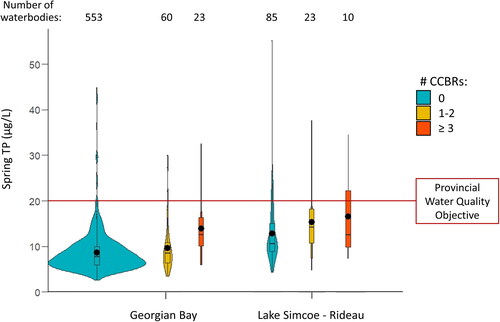
Figure 6. Yearly length of the cyanobacterial bloom reporting period to the Ministry of the Environment, Conservation and Parks between 1998 and 2019, indicated by the shaded area. White triangles indicate the first confirmed cyanobacterial bloom report in each year, while black circles indicate the last report in each year. This figure does not include confirmed cyanobacterial bloom reports in artificial ponds, lagoons and ditches, or harbors and boat canals.
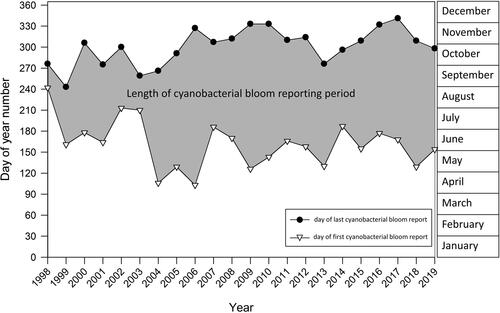
Table 1. P-values (P) and Bonferroni-adjusted P-values for multiple comparisons (Padj) examining differences in mean spring total phosphorus (TP) concentrations among inland lakes and rivers with no confirmed cyanobacterial bloom reports (CCBRs), 1–2 CCBRs, and ≥3 CCBRs in the Georgian Bay and Lake Simcoe–Rideau ecoregions. Note that waterbodies without CCBRs may have had unreported cyanobacterial blooms.
Table 2. Number of confirmed cyanobacterial blooms (CCBRs) dominated by 7 of the most common cyanobacterial genera/complexes in Ontario between 1994 and 2019, by ecozone and waterbody type.
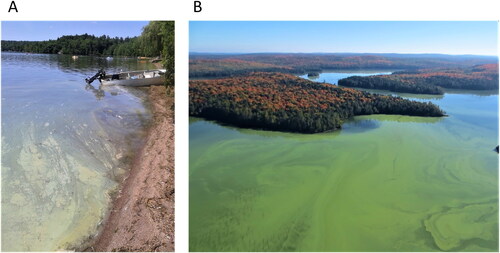
Figure 8. Examples of cyanobacterial blooms in Ontario lakes at a localized (A) and whole-lake (B) scale. Photographs provided by the Ontario Ministry of the Environment, Conservation and Parks (A), and by Alison Lake, Ontario Ministry of Natural Resources and Forestry (B).