
Figures & data
Figure 1. Maps of the locations of the (a) reservoirs included in the statewide assessment, with red diamonds indicating those located in the Plains region and blue circles indicating those located in the Highlands region; (b) 15 Plains reservoirs (red diamonds), Lake Woodrail (green star), Lake of the Ozarks (blue circle), and Truman Lake (yellow square); and (c) streams included in the statewide assessment, with red diamonds indicating Plains streams and blue circles indicating Highlands streams; Hinkson Creek is indicated with a green star.
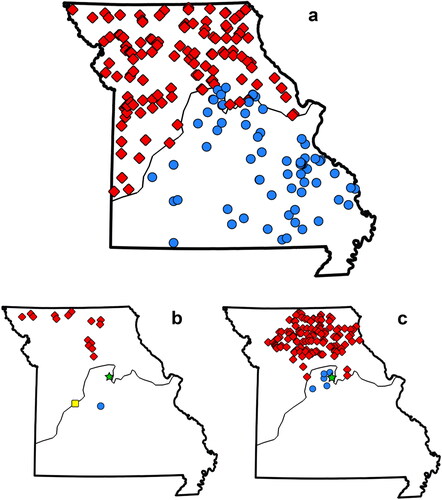
Table 1. Summary statistics for select water-quality and hydrologic, land cover, and edaphic watershed features in 203 Missouri reservoirs sampled routinely during May–Aug 1997–1999, 2004–2007, and 2009–2016. Water-quality summary statistics are presented for individual samples and reservoir means. Specific conductance is abbreviated as KSP.
Table 2. Summary statistics for select water-quality and hydrologic, land cover, and edaphic watershed features in Missouri Plains and Highlands reservoirs. Water-quality data are presented as reservoir means. Specific conductance is abbreviated as KSP.
Figure 2. Relation between latitude and geometric mean of dissolved organic carbon (DOC) concentrations in reservoirs located in the Highlands (blue circles) and Plains (red diamonds) regions of Missouri.
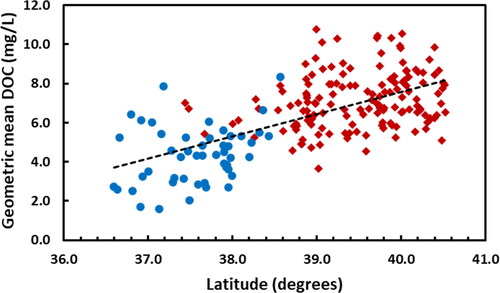
Table 3. Summary statistics for select water-quality and hydrologic, land cover, and edaphic watershed features in 15 Plains reservoirs sampled weekly during 2004. Water-quality data are given for individual samples from the 15 reservoirs during the study and as mean values among the reservoirs. Specific conductance is abbreviated as KSP.
Figure 3. Seasonal patterns in dissolved organic carbon (DOC) in (a) 15 Plains Missouri reservoirs sampled for 49 consecutive weeks in 2004 (data were normalized [observation – mean/standard deviation]) and (b) Lake Woodrail, sampled daily from Mar 1995 to Dec 1996.
![Figure 3. Seasonal patterns in dissolved organic carbon (DOC) in (a) 15 Plains Missouri reservoirs sampled for 49 consecutive weeks in 2004 (data were normalized [observation – mean/standard deviation]) and (b) Lake Woodrail, sampled daily from Mar 1995 to Dec 1996.](/cms/asset/4ba4eec1-7a72-46c3-9a9e-237c09dce85f/ulrm_a_2326057_f0003_b.jpg)
Figure 4. The relation between May through Aug discharge from Lake of the Ozarks (presented as seasonal volume divided by lake volume; unity would be one equivalent volume flushing) and seasonal geometric mean dissolved organic carbon concentrations averaged across 8 sampling sites during Jul–Aug 2007–2014.
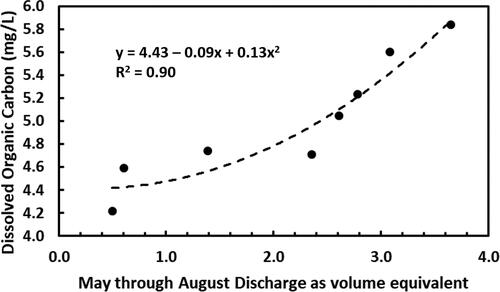
Table 4. Summary statistics for select water-quality measures, slope, and land cover in Missouri Plains and Highlands streams. Specific conductance is abbreviated as KSP.