Figures & data
Figure 1. Schematic diagram of the Perceptual Assimilation Model (PAM; Best, Citation1995; Best & Tyler, Citation2007), illustrating an adult's native language phonological space, in which the conical “islands” represent native consonant categories that have been delineated and sharpened by experience with perceiving and producing native speech, and the major predicted patterns of perceptual assimilation of nonnative consonant contrasts to the native phonological system. Pairs of black circles represent nonnative consonant contrasts, with the various predicted contrast assimilation patterns indicated by arrows and labels.
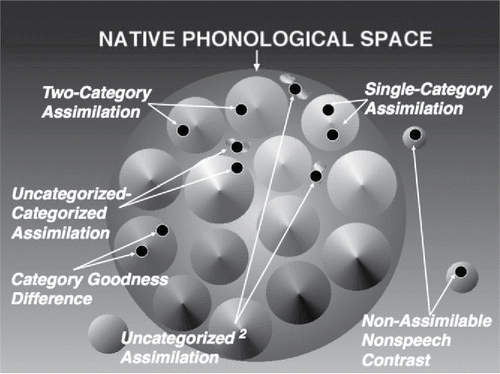
Figure 2. Schematics of the three dimensions of articulatory gestures as proposed for the revised Perceptual Assimilation Model with Articulatory Organ Hypothesis (PAM-AOH): (A) articulatory geometry (modeled after Browman & Goldstein, Citation1989, Citation1992); (B) articulatory organ hierarchy (active articulators and their nested nodes), which is an unfolded, straightened version of A; (C) articulatory actions (constriction degrees) represented along a straightened side view of the vocal tract's ventral (lower surface: active articulators) and dorsal (upper surface: passive articulators/locations) surfaces.
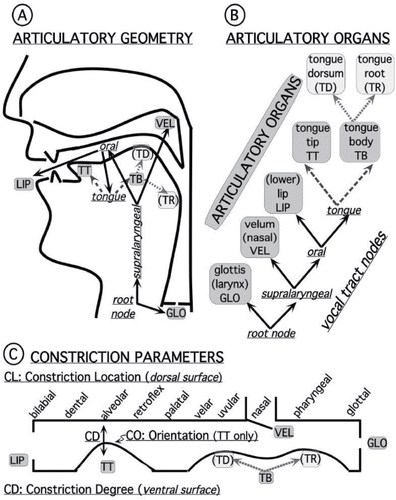
Table 1. Summary of prior findings on infants' perception of native and nonnative consonant contrasts at 6–8 versus 10–12 months of age, as interpreted in terms of the epigenetic trajectories posited for infant speech perception development (Aslin & Pisoni, Citation1980) and suborganized according to Articulatory Organ Hypothesis predictions for between-organ [unshaded] versus within-organ [light shading] contrasts (AOH; Best & McRoberts, Citation2003; L. M. Goldstein, Citation2003; L. M. Goldstein & Fowler, Citation2003; Studdert-Kennedy & Goldstein, Citation2003) and our newly introduced privative contrasts [medium shading] (+/– gesture of a given articulator).
Figure 3. (A) Frequency distribution of tongue tip (TT) constriction location along hard palate (normalized to 0–1), as measured by electromagnetic articulometry (EMA), for all coronal stops in a natural spoken English passage of ∼1,000 words produced by an adult female native speaker (L. M. Goldstein et al., Citation2008); (B) corresponding distribution for all coronal stops in a natural spoken Hindi passage of ∼6,000 words produced by an adult female native speaker (L. M. Goldstein et al., Citation2008).
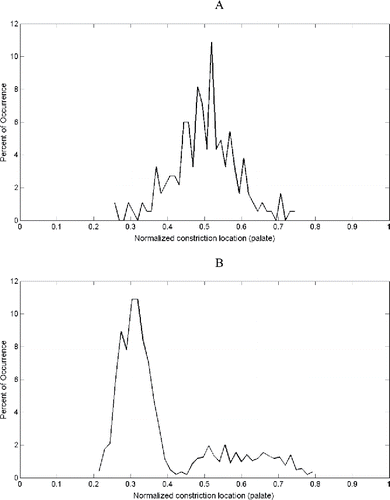
Figure 4. Simulation of “blank slate” infant (lower left) attunement to English “parent” input (top center) based on articulatory data from a native English speaker, which shows a unimodal frequency distribution of alveolar Tongue Tip (TT) constriction locations along the hard palate (normalized 0–1). The time series (lower portion of diagram) indicates successive 2,500-iteration steps in the 10,000-iteration simulation.
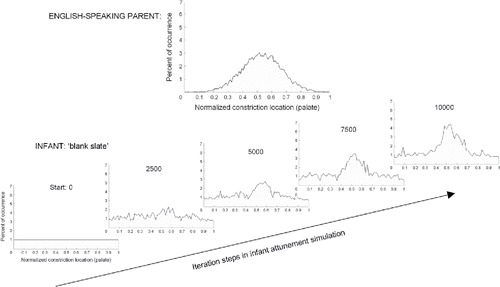
Figure 5. Simulation of “blank slate” infant (lower left) attunement to Hindi “parent” input (top center) based on articulatory data from a native Hindi speaker, which shows a bimodal frequency distribution of dental versus retroflex Tongue Tip (TT) constriction locations along the hard palate (normalized 0–1). The time series (lower portion of diagram) indicates successive 2,500-iteration steps in the 10,000-iteration simulation.
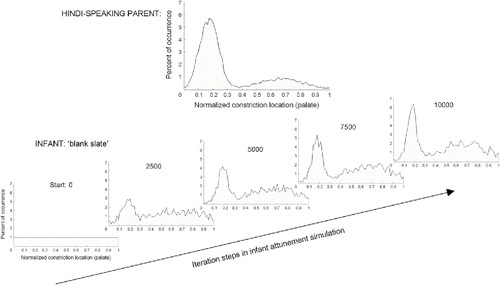
Figure 6. Simulation of an adult second language (L2) learner of Hindi showing native-language (L1) Single Category (SC) assimilation (lower left) and L2 attunement (time series) to input from an idealized Hindi “teacher” (top center). The L2 learner is an idealized speaker of English with a well-established unimodal distribution of English coronal stops centered at alveolar position, which does not line up with either Hindi mode. The time series shows the same simulation steps as in .
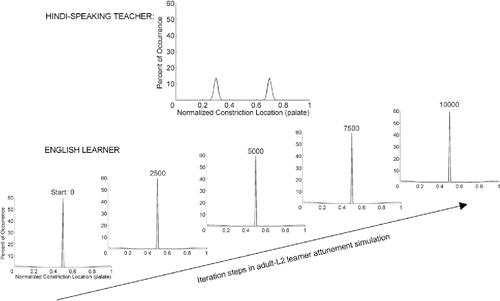
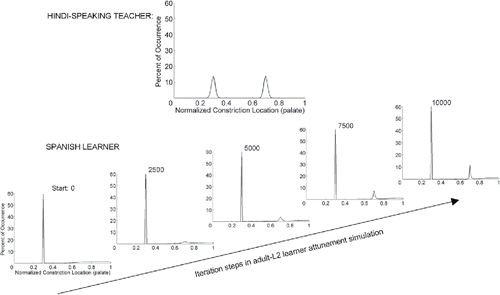
Figure 7. Simulation of a different adult L2 Hindi learner showing initial L1 Category Goodness difference (CG) assimilation (lower left) and L2 attunement (time series) to input from the same idealized Hindi “teacher” (top center) and simulation steps as in . The second language (L2) learner is an idealized native language (L1) speaker of Spanish with a well-established unimodal distribution of Spanish coronal stops centered at dental position, which does line up with one of the two Hindi modes (dental).