Figures & data
Figure 1. The reheat and recompression arrangement of S-CO2 Brayton cycle.
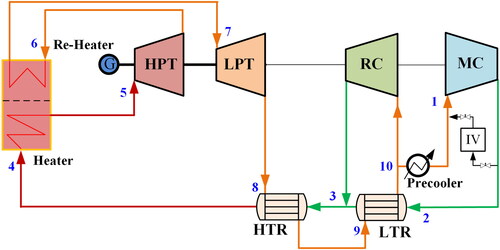
Figure 2. Temperature-entropy diagram of a reheat and recompression S-CO2 Brayton cycle.
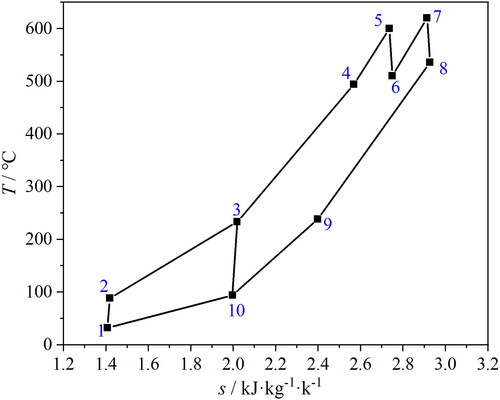
Table 1. Design parameters of the base cycle [Citation26].
Figure 3. S-CO2 recompression Brayton dynamic simulation system.
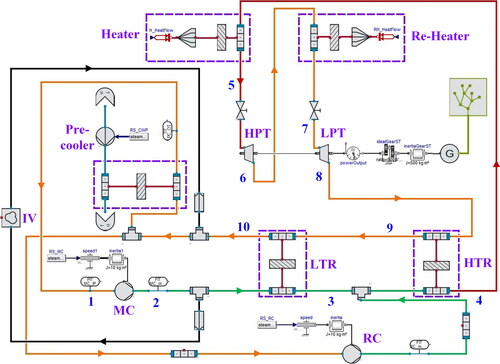
Table 2. Geometrical parameters of the HTR and LTR [Citation26].
Figure 4. Segmented model for PCHE with semicircular channels.
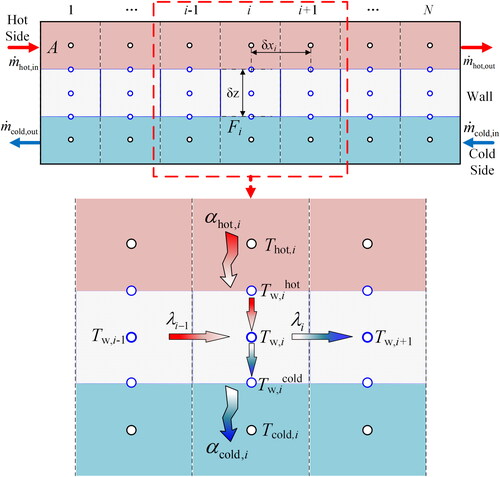
Figure 5. Compressor characteristics curves: (a) relative compression ratio; (b) relative efficiency.
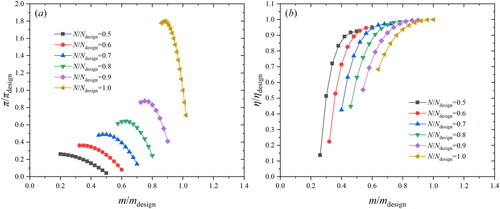
Figure 6. Turbine characteristics curves: (a) relative expansion ratio; (b) relative efficiency.
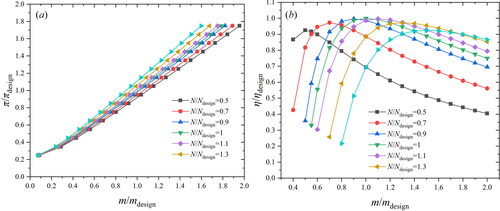
Figure 7. Pressure and split ratio control schemes.
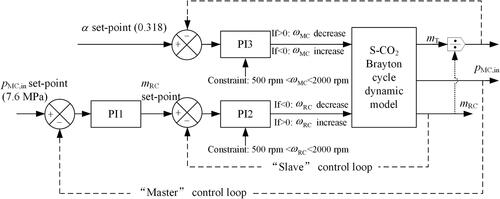
Figure 8. Temperature profiles on the cold- and hot-side, and temperature difference in the PCHE.
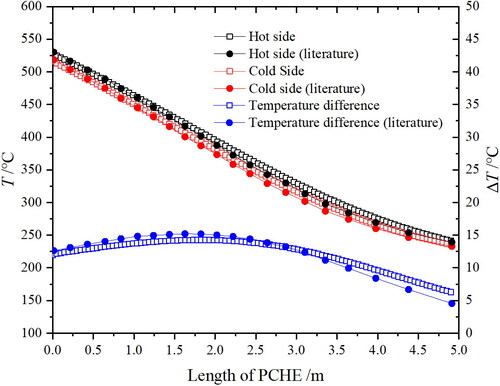
Table 3. Comparison of the calculation results and literature data of S-CO2 cycle [Citation26].
Figure 9. Comparison in the relative turbine efficiency variation with relative rotating speed.
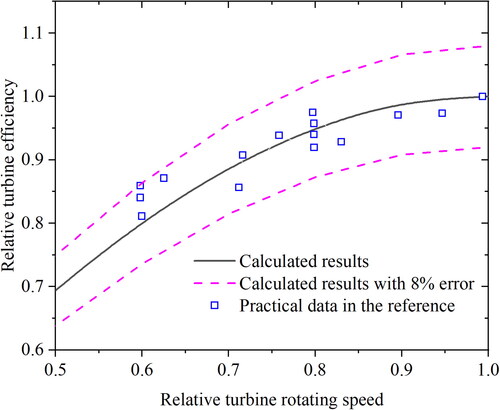
Figure 10. Fluctuations of mass flow (a) and pressure (b) following with set values.
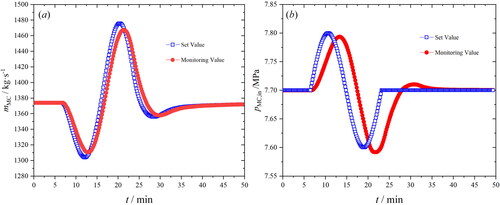
Figure 11. Variations of the S-CO2 Brayton cycle load under different inventory withdraw-mass.
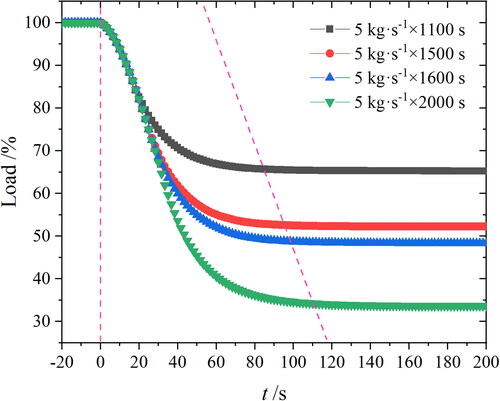
Figure 12. The effects of withdraw-mass from cycle to inventory vessel.
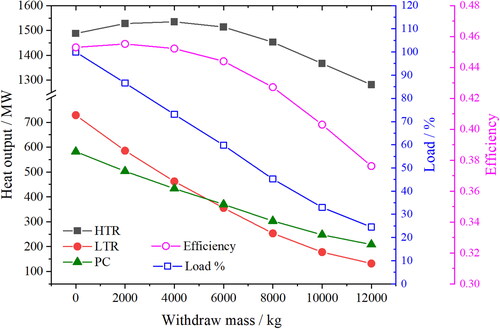
Table 4. Parameters in the cycle in different off-design conditions.
Figure 13. Outlet temperature transient variations of cold-side (a) and hot-side (b) fluids under mass flowrate stepwise varying conditions.
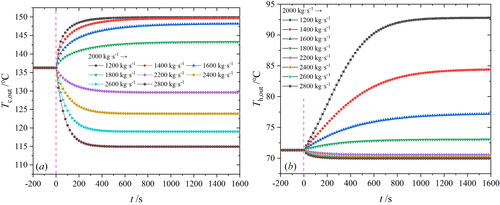
Figure 14. Pinch point location transient variations under mass flowrate stepwise-varying conditions.
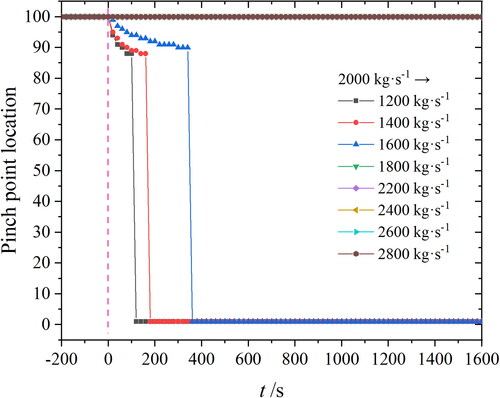
Figure 15. Pinch point temperature difference (a) and heat exchanger effectiveness (b) transient variations under mass flowrate stepwise-varying conditions.
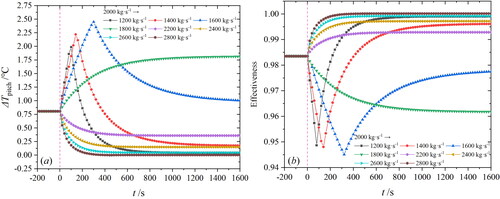
Figure 16. Outlet temperature variations of cold-side (a) and hot-side (b) fluids with time under pressure stepwise-varying conditions.
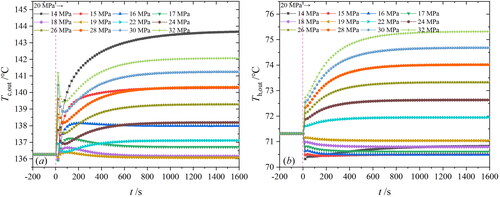
Figure 17. Pinch point location variations with time under pressure stepwise-varying conditions.
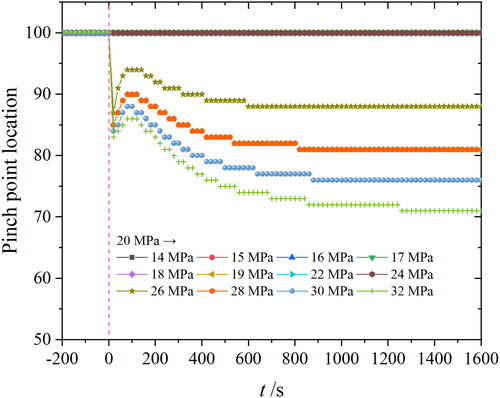
Figure 18. Pinch point temperature difference (a) and heat exchanger effectiveness (b) variations with time under pressure stepwise-varying conditions.
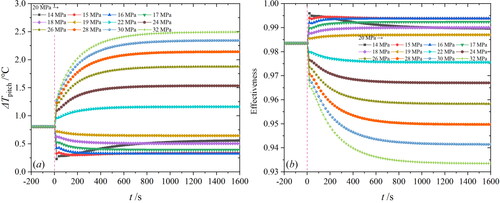
Figure 19. Outlet temperature variation of cold-side (a) and hot-side (b) fluids with time under temperature stepwise-varying conditions.
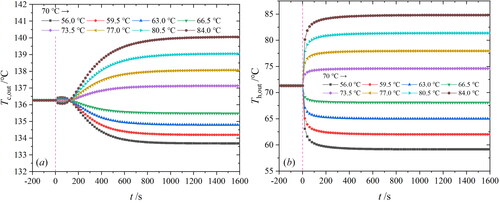
Figure 20. Pinch point location variations with time under temperature stepwise-decreasing (a) and stepwise-increasing (b) conditions.
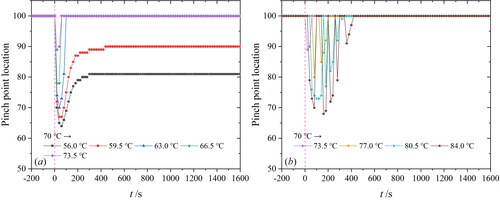
Figure 21. Pinch point temperature difference (a) and heat exchanger effectiveness (b) variations with time under temperature stepwise-varying conditions.
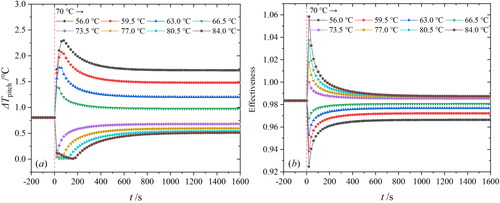
Figure 22. Comparison between the segmented model and the prediction model.
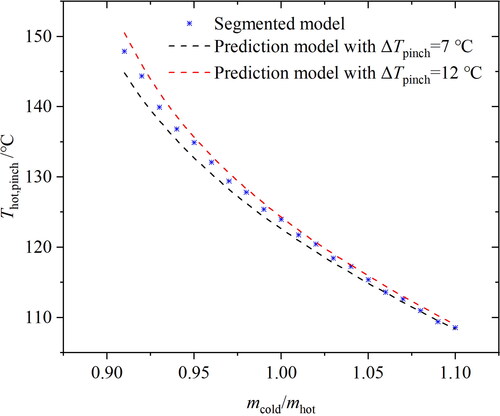
Figure 23. The variations of upper and lower CSRs with the temperature at the outlet of the precooler.
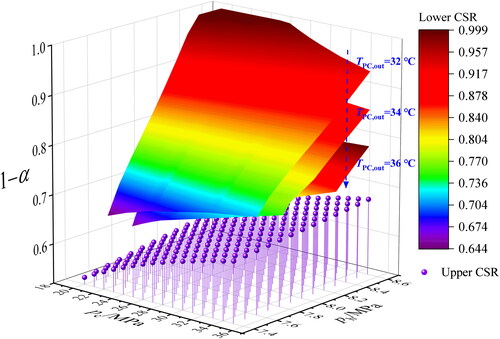
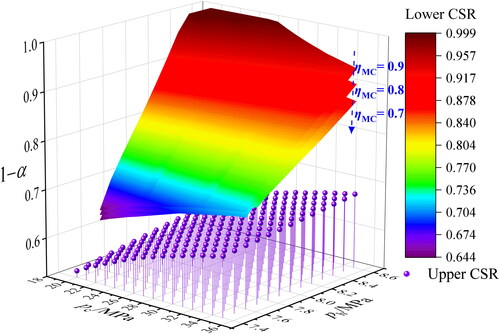
Figure 24. The upper and lower critical split ratio variation with isentropic efficiency of compressor.