Figures & data
Table 1. Overview of methods for disease monitoring in multiple myeloma patients.
Figure 1. Graphical illustration of Intact protein MS versus Bottom-up MS. Intact protein MS measures light chain m/z using MALDI-TOF which can reach high throughput and is easier to standardize. Personalized targeting of monoclonal peptides using bottom-up MS is technically more complex but increases the sensitivity of the assay.
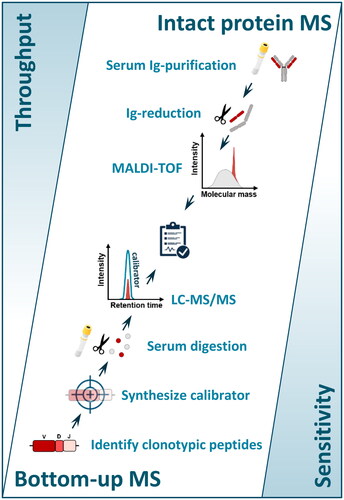
Table 2. Overview of intact protein MS methods to detect M-proteins.
Table 3. Overview of bottom-up MS methods to detect M-proteins.
Figure 2. Schematic representation of the impact of serum half-life (t1/2) on M-protein monitoring. (A) Depending on the Ig t1/2 of the Ig-isotype, there is a certain delay between the lysis of clonal plasma cells and the decrease in serum M-protein. Responses are shown for hypothetical immediate and 100% effective therapeutic intervention in patients with an IgG-, IgA-, and FLC-M-protein. Based on the M-protein isotype and the response kinetics, therapy effectiveness can be calculated. (B) In clinical practice this would mean that hypothetical patient 2 (IgG M-protein, continuous line) experiences a 100% effective therapy response (inside IgG shaded area). Although hypothetical patient 1 (IgA M-protein, dotted line) has a steeper response curve, the therapy response is less effective (outside IgA shaded area). t1/2 = half-life.
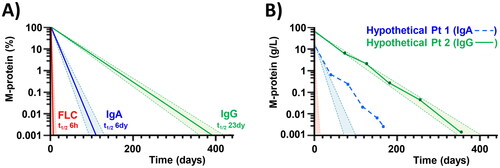
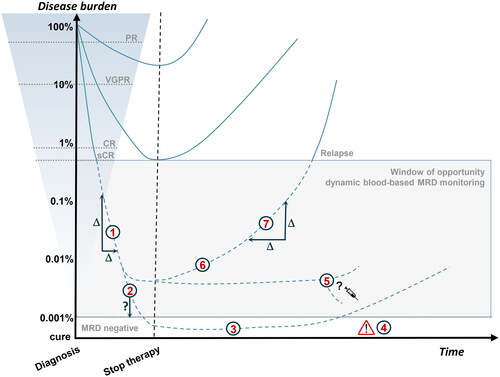
Figure 3. Schematic representation of therapeutic response evaluation. Visualization of the paradigm that deep responses are prognostic for longer survival. Current blood-based assays are not sensitive enough to monitor disease activity beyond sCR (dotted lines). The shaded box indicates the window of opportunity for more sensitive blood-based MRD monitoring with several potential clinical applications: (1) Therapy response kinetics as a potential prognostic marker; (2) Optimize timing of bone marrow sampling; (3) Diagnose sustained MRD-negativity; (4) Disease monitoring of patients with false-negative MRD results caused by extramedullary disease; (5) MRD-guided treatment decisions; (6) Early relapse detection; (7) Relapse kinetics as a potential prognostic marker. PR: partial response; VGPR: very good PR; CR: complete response; sCR: stringent complete response; MRD: minimal residual disease.