
Figures & data
Figure 1. PRISMA 2020 flow diagram.
From: Page MJ, McKenzie JE, Bossuyt PM, et al. The PRISMA 2020 statement: an updated guideline for reporting systematic reviews. BMJ. 2021;372:n71. doi: 10.1136/bmj.n71.
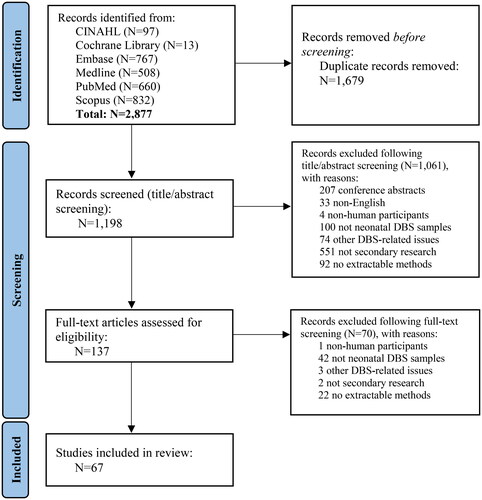
Table 1. Key characteristics of included studies.
Table 2. Summary of methods used in included studies.
Table 3. Summary of analytes successfully measured using neonatal dried blood spot (DBS) samples stored at varying temperatures and their maximum duration of storage as reported in the included studies.
Table 4. Summary of studies directly comparing methods used on neonatal dried blood spot (DBS) samples.
Supplemental material