
Figures & data
Figure 1. Table summarizing the technological functionality of all ingredients in cake during mixing, baking, cooling and storage.
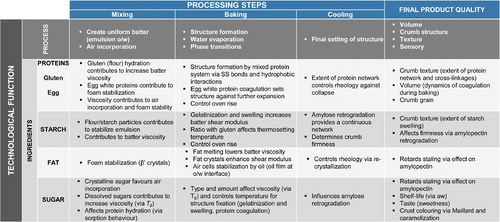
Figure 2. Pictorial representation of cake ingredients, with different proteins indicated by different subscripts.
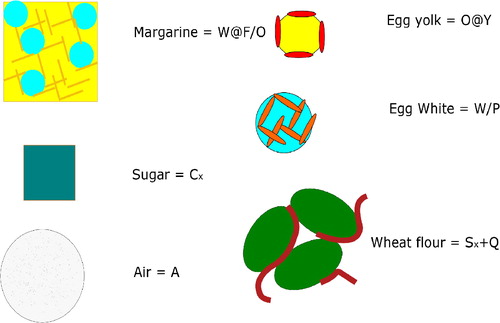
Figure 3. Structure of the cream:
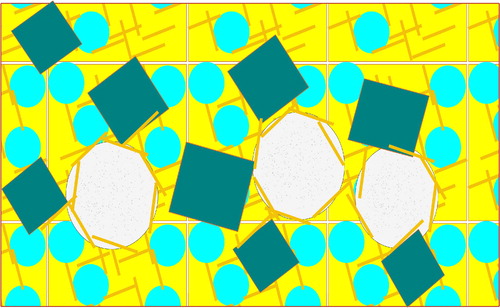
Figure 4. Batter structure after adding egg to the cream:
![Figure 4. Batter structure after adding egg to the cream: [A@F/(W/O)]@Y / (W+C)/P.](/cms/asset/b3d0300c-3ffd-4ffe-bb1c-8b223f766623/bfsn_a_1786003_f0004_c.jpg)
Figure 5. Batter structure after adding flour:
![Figure 5. Batter structure after adding flour: [A@F/(W/O)]@Y / [ Sx+W/Q+(W+C+R)/P ].](/cms/asset/011535ef-aa4a-480f-9c15-3894eca7b16c/bfsn_a_1786003_f0005_c.jpg)
Figure 6. Batter structure after fat melting during baking:
![Figure 6. Batter structure after fat melting during baking: (A@O)@Y / [ Sx+W/Q+(W+C+R)/P ].](/cms/asset/adfe660a-798f-42a6-9d29-7ab250555678/bfsn_a_1786003_f0006_c.jpg)
Figure 7. Bubble expansion during baking:
![Figure 7. Bubble expansion during baking: [((A+G+V)@O)@(Y+P)] / [ (Sx+W/Q)+(W+C+R)/P ].](/cms/asset/bf56ebff-36b3-4d89-9977-74646863de7c/bfsn_a_1786003_f0007_c.jpg)
Figure 8. Thermosetting of batter during baking:
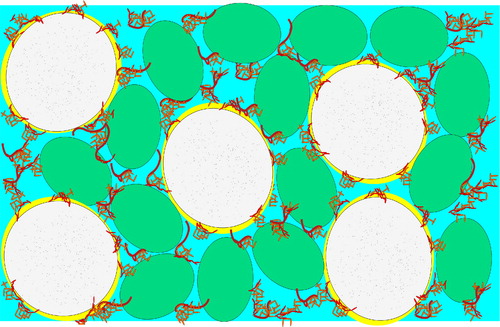
Figure 9. Firming of the cake during cooling via amylose retrogradation:
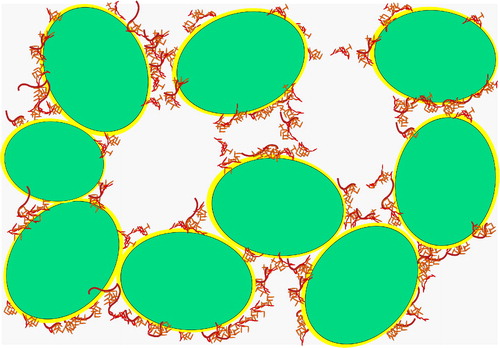
Figure 10. Denaturation temperature TD of (spray) dried egg white as function of ϕw,eff, the effective solvent volume fraction for various solutions containing sugar replacers. The solid line is fitted to Flory–Huggins theory with ζ = 0.6, Tm = 415 K, and
= 57 kJ/mol.
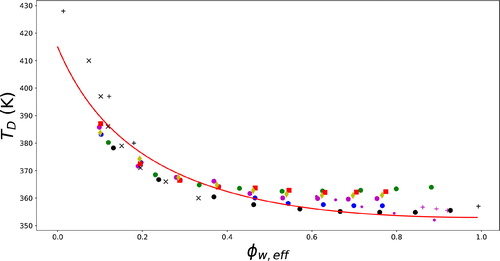
Figure 11. Main peak temperature of starch gelatinization Tgel as a function of ϕw,eff, the effective solvent volume fraction, for various solutions with sugar replacers. The solid line is fitted to Flory–Huggins theory with ζ = 0.45, Tm=500 K, and
=24 kJ/mol. The symbols represent experimental data: different shapes and colors indicate different sugar (replacers). We have used the same symbols for the ingredients as listed in .
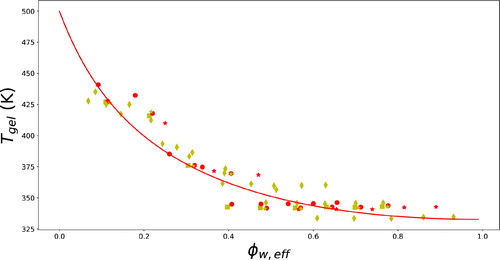
Figure 12. Processing pathway of the state of cake batter during baking (blue squares) as determined from measurements by Deleu et al. (Citation2019), plotted on the state diagram, along with egg white denaturation and starch gelatinization. For comparison the (slightly shifted) pathway for bread crust during baking (Vanin et al. Citation2010), is also shown (yellow stars).
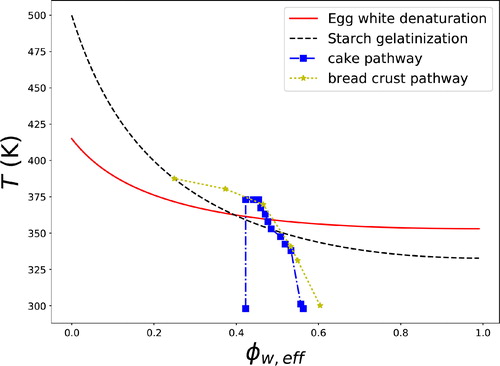
Table 1. Data sources used for denaturation of (dried) egg white and ovalbumin.