Figures & data
Table 1. Summary of study characteristics for publications included in the meta-analyses.
Figure 1. Flow chart of study selection and inclusion.
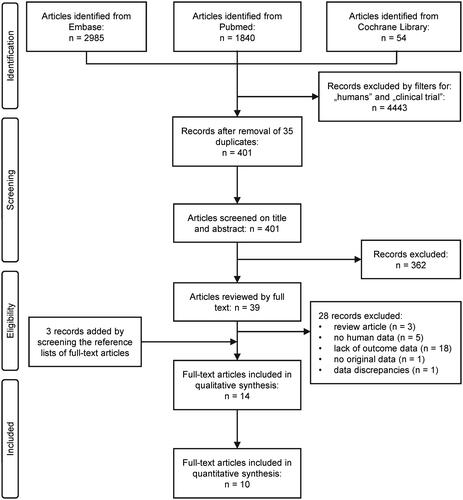
Figure 2. Forest plot of the effects of capsaicinoids (top) and capsaicinoid-containing mixtures (bottom) on serum total cholesterol level. Here, and in , for each study, we calculated the difference between serum cholesterol levels in the capsaicinoid-treated group and the control group at the end of the intervention period. For all studies, the differences in means were standardized (based on variances) to obtain standardized mean differences (SMDs). The SMDs and 95% confidence intervals (CI) are used as primary measures of effect size and are shown in the forest plot. Black circles represent the SMD for each study, while the left and right horizontal arms of the circles indicate the corresponding CI. The size of the gray box is proportional to the sample size and inversed variance. The rhombus represents the average SMD calculated from the SMDs of the individual studies in a subgroup (top and middle) and in all studies (bottom). The horizontal diagonal of the rhombus represents the CI, while the vertical diagonal of the rhombus points at the SMD value of the subgroup or of all studies. The dashed line is determined by the vertical diagonal of the bottom rhombus and indicates the SMD of all studies in the forest plot. There was no significant difference between the two subgroups (Q = 0.709; p = 0.400). SD, standard deviation.
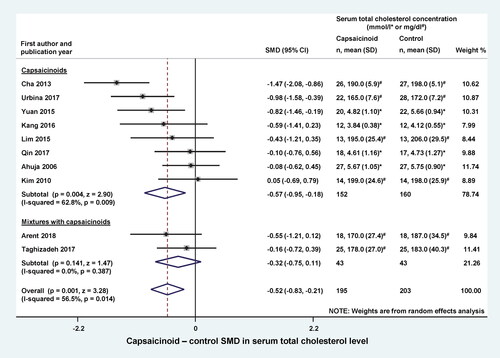
Figure 3. Forest plot of the effects of capsaicinoids (top) and capsaicinoid-containing mixtures (bottom) on serum low-density lipoprotein (LDL) cholesterol level. There was no significant difference between the two subgroups (Q = 0.006; p = 0.940). CI, confidence interval; SD, standard deviation; SMD, standardized mean difference.
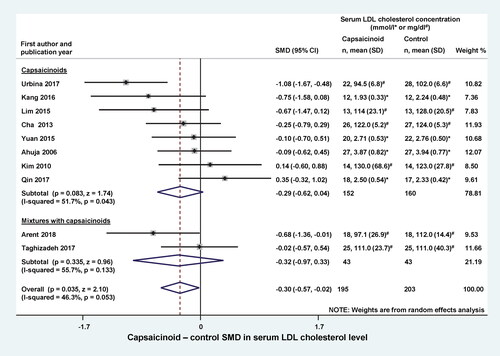
Figure 4. Forest plot of the effects of capsaicinoids (top) and capsaicinoid-containing mixtures (bottom) on total serum triglyceride level. There was no significant difference between the two subgroups (Q = 0.216; p = 0.642). CI, confidence interval; SD, standard deviation; SMD, standardized mean difference.
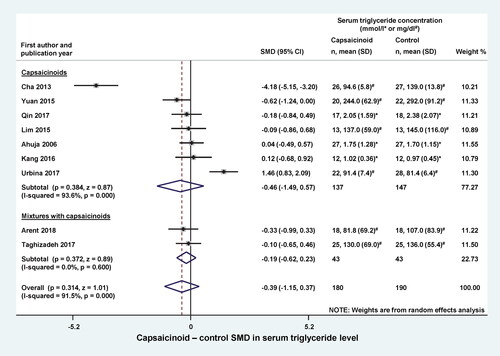
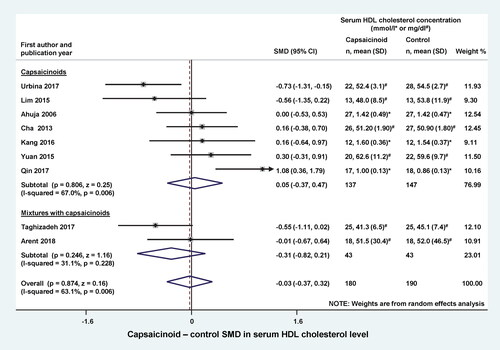
Figure 5. Forest plot of the effects of capsaicinoids (top) and capsaicinoid-containing mixtures (bottom) on serum high-density lipoprotein (HDL) cholesterol level. There was no significant difference between the two subgroups (Q = 1.115; p = 0.291). CI, confidence interval; SD, standard deviation; SMD, standardized mean difference.