Figures & data
Figure 1. Maize production a) and yields b) of the world, U.S., China and Brazil from 1961 to 2020 (FAOSTAT Citation2021).
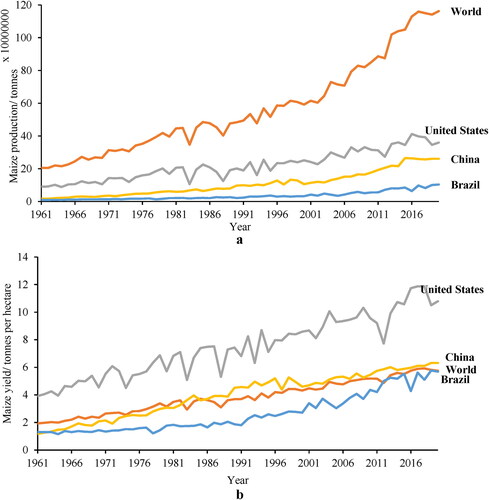
Figure 2. Maize wet milling process and MGM.
a) wet milling process, b) dry MGM, c) wet MGM. a) adapted from Blasi et al. (Citation2001); b) and c) from Ribeiro et al. (Citation2019) under CC BY 4.0.
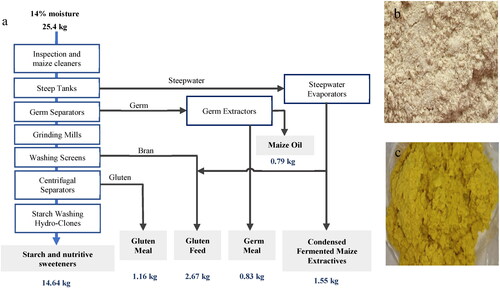
Table 1. Mycotoxin prevalence in maize in different regions.
Table 2. Fate of mycotoxins during wet milling.
Table 3. Mycotoxin decontamination potential of LAB in maize and maize products and related mechanisms.
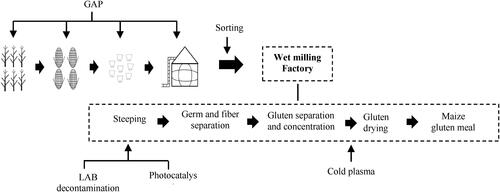
Figure 3. Risk management strategy for mycotoxins in MGM from the field to the end-product.