
Figures & data
Figure 1. Participant eligibility for the final EPIC-Norfolk cohort.
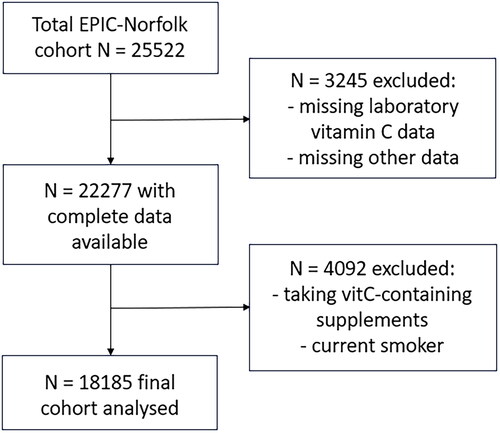
Figure 2. Participant eligibility for the final NHANES 2017–2018 cohort.
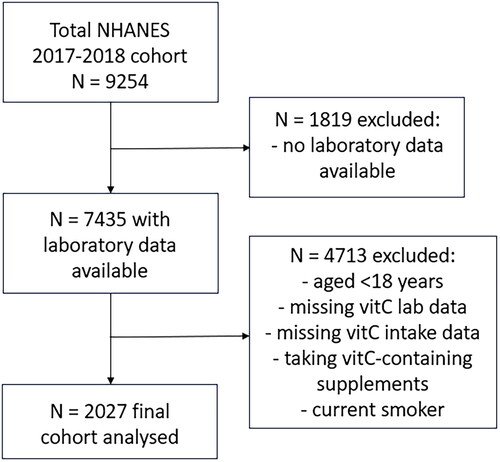
Table 1. Characteristics of the EPIC and NHANES cohorts.
Figure 3. Correlations of weight with vitamin C intake and status in the EPIC and NHANES cohorts. (a) Intake data from EPIC cohort (green line; n = 18185; slope = -0.04) and NHANES cohort (blue line; n = 2027; slope = 0.14). (b) Plasma/serum data from EPIC cohort (green line; n = 18185; slope -0.35) and NHANES cohort (blue line; n = 2027; slope = -0.26). (c) EPIC data from high intake tertile (green line; n = 6056; slope = -0.38), medium intake tertile (orange line; n = 6071; slope = -0.35) and low intake tertile (red line; n = 6058; slope = -0.31). The slopes of the high and low intake tertiles were significantly different (p = 0.005). (d) NHANES data from higher intake category (green line; n = 675; slope = -0.27) and lower intake category (red line; n = 676; slope = -0.22). The slopes were not statistically different (p = 0.2). Lines indicate Pearson linear correlation with 95% confidence intervals indicated by dotted lines. An ‘adequate’ vitamin C concentration of 50 µmol/L is indicated by the horizontal dashed line.
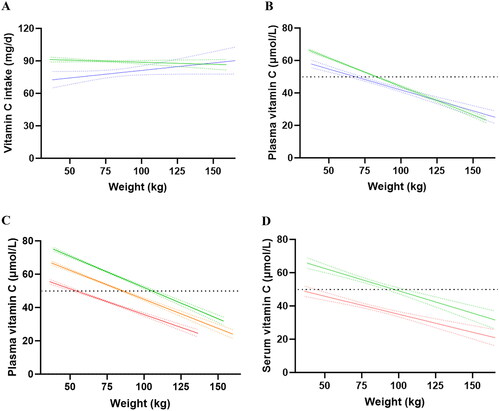
Table 2. Characteristics of vitamin C intake categories in the EPIC and NHANES cohorts.
Figure 4. Proportion of participants reaching (green bars)/not reaching (red bars) adequate vitamin C status at different weights in the EPIC (a) and NHANES (b) cohorts. The mean (SD) weight and vitamin C intake for the EPIC cohort was 73 (64, 82) kg and 79 (54, 115) mg/d; and for the NHANES cohort was 80 (69, 96) kg and 59 (27, 106) mg/d. Upper dashed line indicates 97.5% and middle dashed line indicates 50% of the participants.
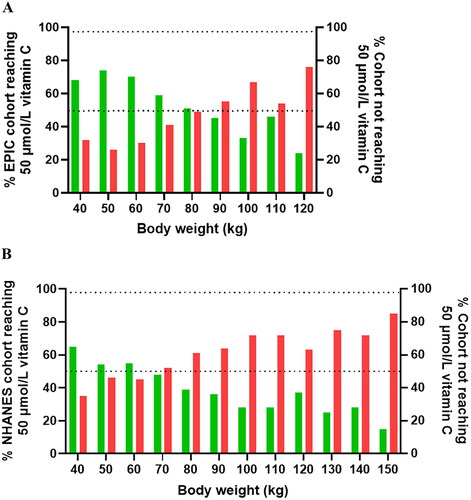
Figure 5. Vitamin C dietary intake versus plasma concentration curves in the EPIC cohort. (a) Intake versus concentration curve for total EPIC cohort (n = 18185). (b) Intake versus concentration curves for lighter weight tertile (green line; n = 6028), medium weight tertile (orange line; n = 6090) and heavier weight tertile (red line; n = 6067). (c) intake versus concentration curves for females (lighter weight tertile; green; n = 3287 vs heavier weight tertile; red; n = 3295) and (d) males (lighter weight tertile; green; n = 2812 vs heavier weight tertile; red; n = 2848). Sigmoidal (four parameter logistic) curves with asymmetrical 95% confidence intervals were fitted to dose-concentration data to estimate the vitamin C intakes required to reach ‘adequate’ serum vitamin C concentrations of 50 μmol/L (dashed line).
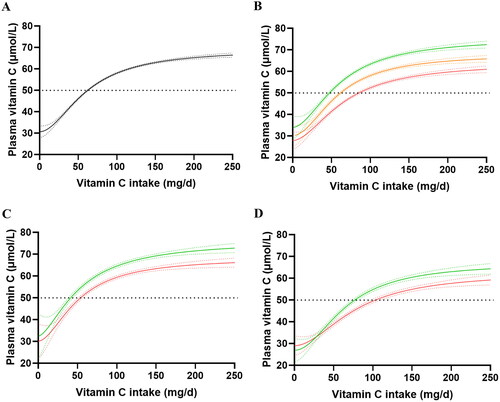
Table 3. Characteristics of weight tertiles in the EPIC and NHANES cohorts.
Figure 6. Proportion of participants in the EPIC and NHANES cohorts reaching adequate vitamin C concentrations at different dietary intake categories. The mean (SD) intake for the (a) total EPIC cohort (green bars) was 89 (50) mg/d and total NHANES cohort (blue bars) was 79 (77) mg/d, (b) EPIC females was 92 (50) mg/d and NHANES females was 74 (66) mg/d, (c) EPIC males was 88 (51) mg/d and NHANES males was 85 (87) mg/d. Upper dashed line indicates 97.5% and middle dashed line indicates 50% of the participants.
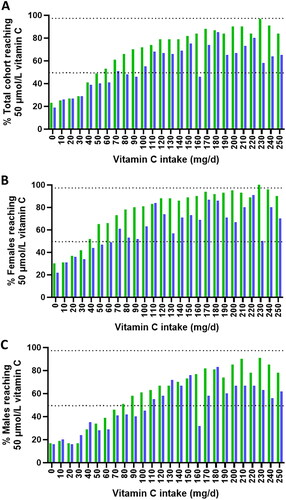
Table 4. Proportion of nonsmoking men and women of the EPIC-Norfolk and NHANES 2017–2018 cohorts reaching ‘adequate’ plasma concentration of 50 µmol/L based on the ingestion of the RDA from UK (40 mg/d) or USA (75/90 mg/d for women, men).
Supplemental Material
Download PDF (327.5 KB)Data availability statement
NHANES 2017–2018 data are publicly available at https://www.cdc.gov/nchs/nhanes/index.htm.
EPIC-Norfolk data are available by request through https://www.epic-norfolk.org.uk/forresearchers/data-sharing/data-requests