
Figures & data
Figure 1. Annual scientific production obtained from Scopus-Web of Science database on PKU-food related search.
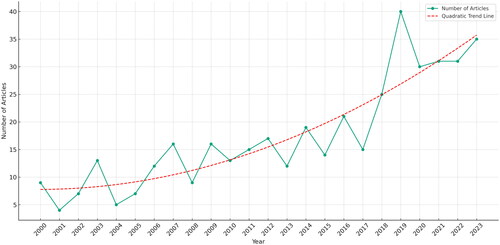
Figure 2. Distribution of corresponding authors’ countries in PKU-related research, categorized by single country publications (SCP) and multiple country publications (MCP).
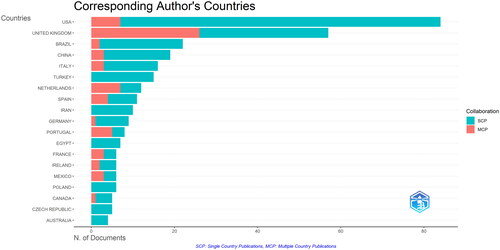
Figure 3. Database keywords co-occurrence network based on the search of PKU-food topic from Scopus and Web of Science database (a, left) and overlay visualization based on temporal dimension from 2000 to 2023 (b, right).
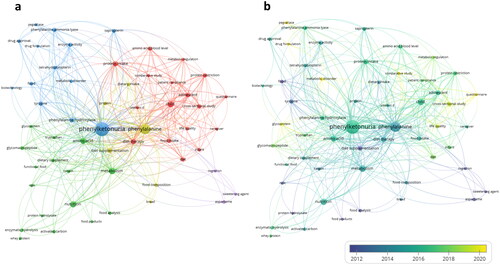
Figure 4. Principal component analysis of keywords from bibliometric database. Each point represents a keyword, color-coded by clusters that signify thematic concentrations in the research field. The axes intersect at zero, highlighting the mean-centered scaling of PCA dimensions.
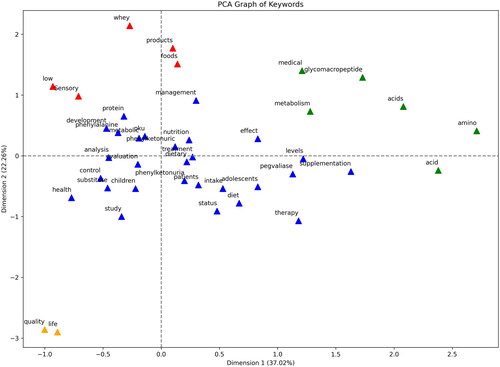
Figure 5. Thematic map of PKU-related food science research trends using bibliometric data.
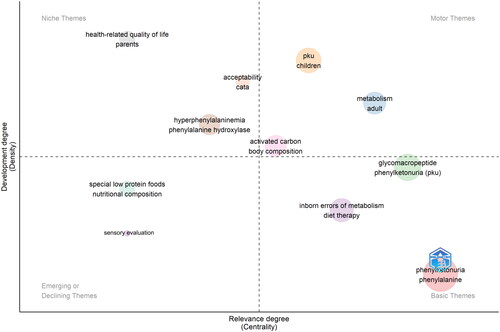
Table 1. PKU specified food supplements list obtained after web research.
Figure 6. Schematic representation of a general 3-D food printer with its main components.
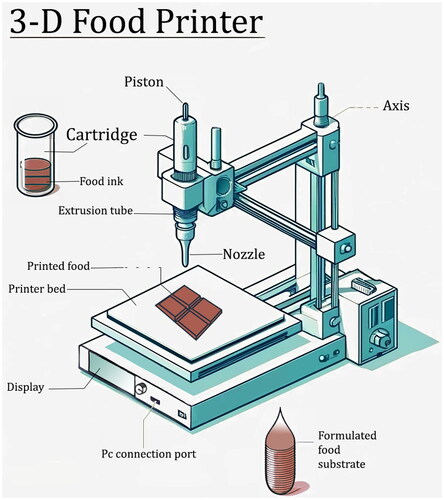
Table 2. Advantages and disadvantages of 3D food printing for PKU food production and formulations.
Data availability statement
The data presented in this study are available on request from the corresponding author.