
Figures & data
Figure 1. Stability of symmetrical (1 on the left, stable) and asymmetrical objects (2 in the middle, unstable, 3 on the right, stable).
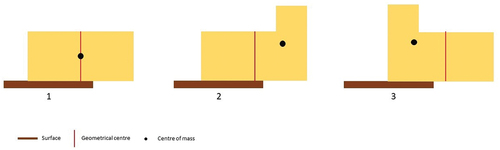
Figure 2. Example items of the COM-Test (A: unstable, B: stable).
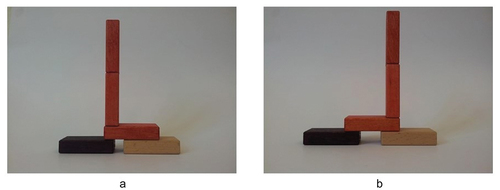
Table 1. Examined variables of preschool teachers’ instructional quality in block play.
Table 2. Descriptive statistics for children’s test scores.
Table 3. Correlations of children’s test results and demographical data.
Table 4. Descriptive statistics of preschool teachers’ instructional quality in block play.
Table 5. Correlations of preschool teachers’ instructional quality in block play.
Table 6. Correlations between children’s test scores and preschool teachers’ overall instructional quality.
Table 7. Correlations between specific dimensions of preschool teachers’ instructional quality and children’s test scores.
Data availability statement
The participants of this study did not give written consent for their data to be shared publicly, so due to the sensitive nature of the research supporting data is not available.