
Figures & data
Figure 1. The three themes and seven sub-themes arising from co-design process. The figure illustrates the codes aligned with each of the sub-themes and themes.
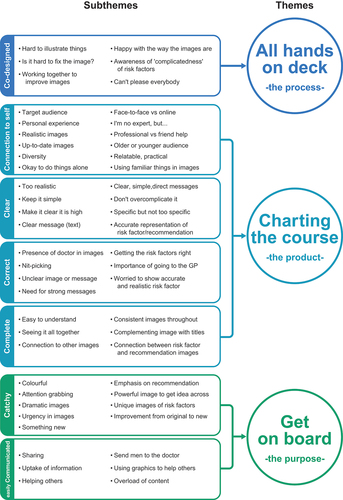
Figure 2. Mitigation strategy for “depression.” Dotted lines highlight main changes discussed in text.
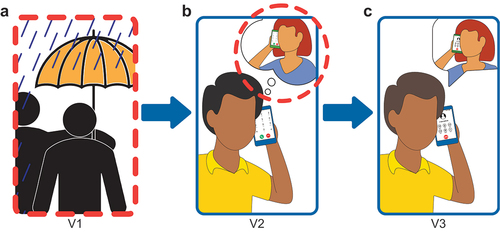
Figure 3. Mitigation strategy for “physical inactivity.” Dotted lines highlight main changes discussed in text.
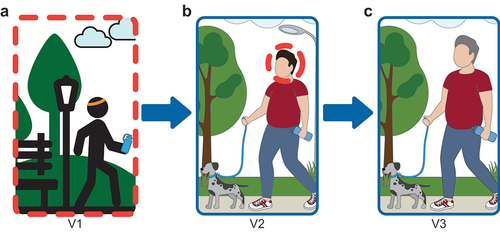
Figure 4. Risk factor “high blood pressure.” Dotted lines highlight main changes discussed in the text.
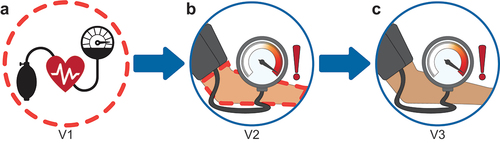
Figure 5. Risk factor “physical inactivity.” Dotted lines highlight main changes discussed in the text.
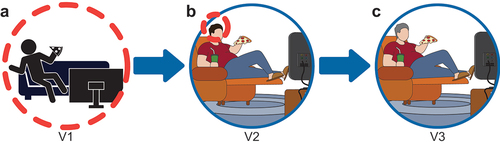
Figure 6. Risk factor “lack of education.” Dotted lines highlight main changes discussed in the text.
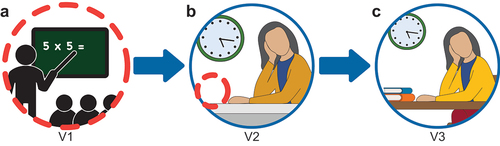
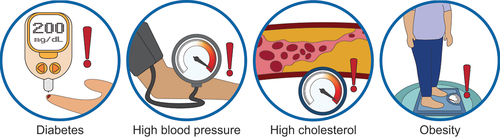
Figure 7. Risk factors using the same red exclamation mark to draw attention to the health issues.
supplementary_file_1_InfographicSurvey.docx
Download MS Word (737.4 KB)Data availability statement
The data are not publicly available due to restrictions imposed by the University of Tasmania Human Research Ethics Committee.
To access the full version of the co-designed infographics, please visit and enroll in the PDMOOC.