
Figures & data
Table 1. The McGuire’s Communication/Persuasion Model outputs.
Table 2. Three classes of theories for health messaging, adapted from Cappella (Citation2006).
Figure 1. PRISMA flow diagram showing the study screening process.
This PRISMA flow diagram shows the study screening process of the systematic literature review. The diagram has four main sections: Identification, Screening, Eligibility, and Included. Each section shows the number of studies or records that were identified, screened, assessed, and included at each stage of the review process, as well as the reasons for excluding some studies or records. The diagram shows that the researchers searched 10 databases and registers and identified 6045 studies or records. After removing 3790 duplicates or irrelevant records, they screened 2255 studies or records by reading their titles and abstracts. They excluded 2109 studies or records for unspecified reasons, leaving 146 studies or records for full-text retrieval and eligibility assessment. None of the studies or records were not retrieved, but 121 were excluded for various reasons, such as qualitative research, study protocol without data, non-empirical research, studies on non-youth/young adult participants, or studies on health warning labels on e-cigarettes ads or promotions. The final number of studies or records included in the review and analysis was 25.
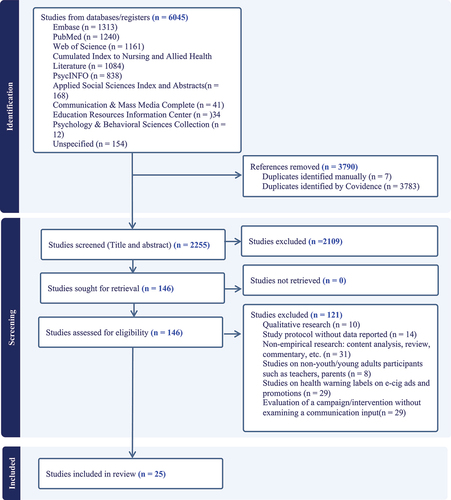
Table 3. Study characteristics and theoretical framework.
Table 4. Main and interaction effects of communication inputs.
Supplemental material