Figures & data
Table 1. Baseline characteristics of all patients.
Table 2. Cancer specific information.
Figure 1. Proportions of nosocomial transmission, severity of illness and complications between HM and SM groups. (A) Pie chart with breakdown of patients with nosocomial COVID-19 along with proportion of patients who subsequently died. (B) Bar graph showing severity of illness in HM and SM groups. (C) Differences in complication rate between HM and SM groups, split by ‘medical complications’ and ‘radiological complications.’ CCF: congestive cardiac failure; VTE: venous thromboembolism; AKI: acute kidney injury; ARDS: acute respiratory distress syndrome; B/L: bilateral; Uni: unilateral; GG: ground glass; AS: airspace.
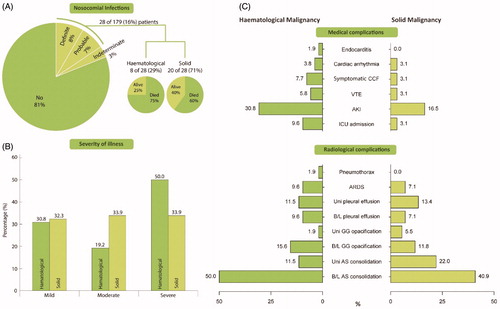
Figure 2. Overall survival of (A) HM and SM patients; (B) nosocomial COVID-19 transmission (definite or probable) and non-nosocomial infection (community acquired or indeterminate cases); (C) all cancer patients receiving systemic anticancer treatment within 4 weeks of COVID-19 and those who did not and (D) HM and SM patients who received chemotherapy within 4 weeks of COVID-19.
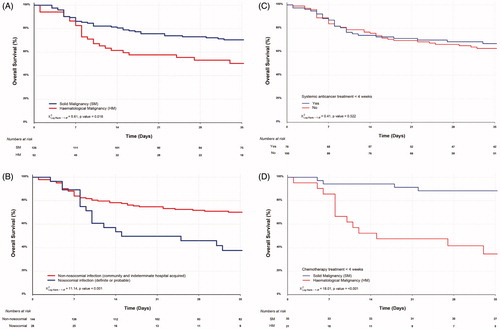
Table 3. Univariable and multivariable analysis of covariates grouped into demographics, cancer type and nosocomial infection, anticancer treatment and investigations with death as an outcome.
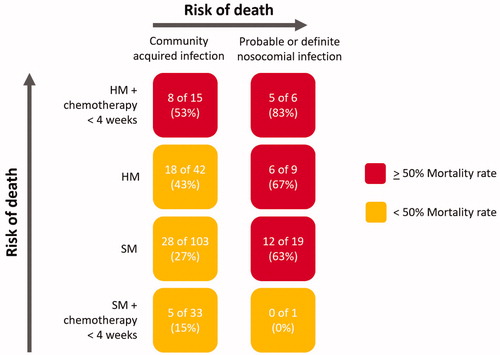
Figure 3. Risk of death relating to nosocomial infection, type of malignancy and whether chemotherapy was received within 4 weeks of COVID-19. The color codes signify the risk of death. HM: haematological malignancy; SM: solid malignancy. HM and SM groups refer to all patients who did not receive chemotherapy within 28 days of COVID-19.