
Figures & data
Figure 1. The effect of ouabain on cell growth and apoptosis. (A) Morphology of Su-DHL4 cells and OCI-Ly3 cells incubated with ouabain (0, 40, and 80 nM) for 48 h were visualized under a light microscope (×200), scale bar = 50 µm. (B) Cell viability of two cell lines after exposure to ouabain (0, 20, 40, 60, 80, 100, 120, 140, and 160 nM) for 24 h were detected by using CCK-8 method. (C) Representative flow cytometric images of apoptosis in Su-DHL4 cells and OCI-Ly3 cells after treated with ouabain (0, 40, and 80 nM). Apoptosis was detected by FITC annexin V staining. (D) The quantitative analysis of apoptotic ratio of cells. ***p < .001: significant differences between solvent control and treatment group. ns: no significant difference.
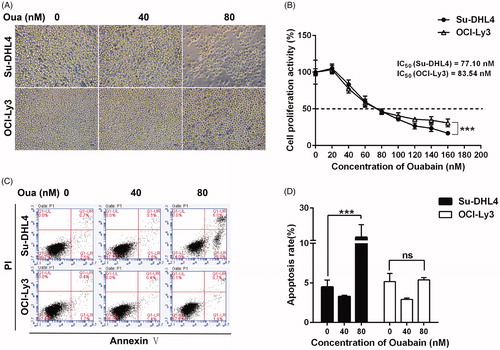
Figure 2. DLBCL cell lines showed different metabolic phenotypes. (A) and (B) Metabolic patterns of intracellular metabolites (A) and culture media metabolites (B) in untreated Su-DHL4 and OCL-Ly3 cells by orthogonal partial least-squared discrimination analysis (OPLS-DA) (SC: Su-DHL4 cells; OC: OCI-Ly3 cells; KB: the blank medium). (C) and (D) Volcano maps of metabolites in cells (C) and culture media (D) detected by GC/MS. The dots in green represent significant lower abundance in Su-DHL4 cells than OCI-Ly3 cells (p < .05 and fold change (SC/OC) < .5). Metabolites of higher abundance in Su-DHL4 were showed as red dots (p < .05 and fold change (SC/OC) > 2). FC fold change. (E) Heat map of significantly different metabolites identified between Su-DHL4 and OCL-Ly3 cells and culture media. (F) Metabolic pathway analysis based on differential metabolites between Su-DHL4 and OCL-Ly3 cells and culture media.
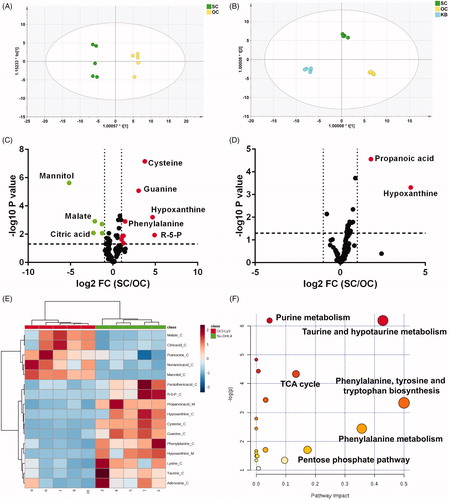
Figure 3. The metabolic response of DLBCL cell lines to ouabain treatment. (A) Metabolic patterns of intracellular metabolites and culture media metabolites in ouabain-treated or untreated Su-DHL4 and OCL-Ly3 cells by OPLS-DA. A1, ouabain-treated or untreated Su-DHL4 cells; A3, corresponding culture media of ouabain-treated or untreated Su-DHL4 cells (SC: control group, SL: 40 nM ouabain-treated group and SH: 80 nM ouabain-treated group). A2, ouabain-treated or untreated OCI-Ly3 cells; A4, corresponding culture media of ouabain-treated or untreated OCI-Ly3 cells (OC: control group, OL: 40 nM ouabain-treated group and (OH: 80 nM ouabain-treated group). (B) Volcano maps of metabolites detected by GC-MS. B1, metabolites of 80 nM ouabain-treated Su-DHL4 cells compared with its control group, B2, metabolites of 80 nM ouabain-treated OCI-Ly3 cells compared with its control group. B3, metabolites in the culture media of 80 nM ouabain-treated Su-DHL4 cells compared with its control group. B4, metabolites in the culture media of 80 nM ouabain-treated Su-DHL4 cells compared with its control group. Green dots: p < .05 and fold change (SC/OC) < .5. Red dots: p < .05 and fold change (SC/OC) > 2.
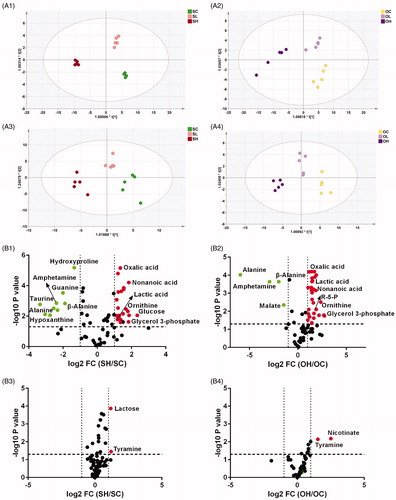
Figure 4. The abundance of typical discriminatory metabolites identified by volcano maps. (A1–A8) Abundance of similarly changed metabolites in both of the two cell lines after ouabain treatment. (B1)–(B4) Abundance of metabolites significantly changed only in Su-DHL4 cells after ouabain treatment. *p < .05, **p < 0.01, ***p < .001 and ns: no significant difference.
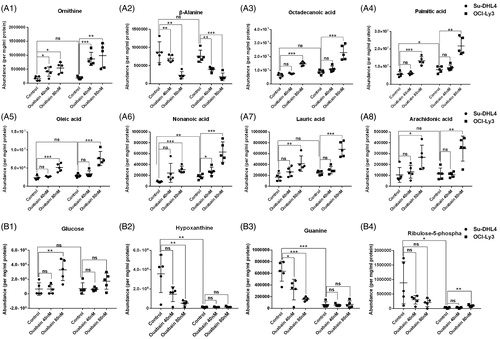
Figure 5. Oxidative stress states contributed to the effect of ouabain in DLBCL cell lines. (A) Schematic description of the pentose phosphate pathway and purine metabolism. NADP+: nicotinamide adenine dinucleotide phosphate; NADPH: reduced nicotinamide adenine dinucleotide phosphate; G6PD: glucose-6-phosphate dehydrogenase; XOD: xanthine oxidase; ROS: reactive oxygen species; PRPP: phosphoribosyl pyrophosphate; HGPRT: hypoxanthine-guanine phosphoribosyltransferase. (B) ROS level of cells detected by flow cytometry without or with ouabain incubation for 2 h. (C) Relative NADPH/NADP + level of cells measured after treated with ouabain for 24 h by using the NADP+/NADPH assay kit. (D) The mRNA expression of XOD, SOD1and CAT in two cell lines and the effect of ouabain by quantitative real-time PCR analysis. *p < .05, **p < .01, ***p < .001, ns: no significant difference. (E) Two cell lines were pretreated with Q-VD-OPh (100 nM and 200 nM) for 2 h and the protein expression of β-Actin, pro-caspase 3, caspase 3, pro-caspase 6, caspase 6, pro-caspase 7, caspase 7, full PARP1, and PARP1 in two cell lines (left panel: Su-DHL4 cells, right panel: OCI-Ly3 cells) with or without treated by ouabain (40 nM or 80 nM) for 48 h were detected by western blot analysis.
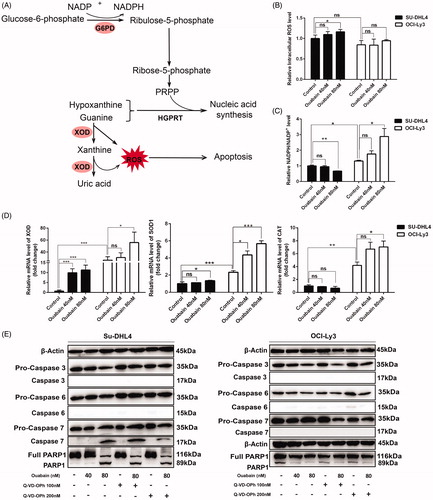
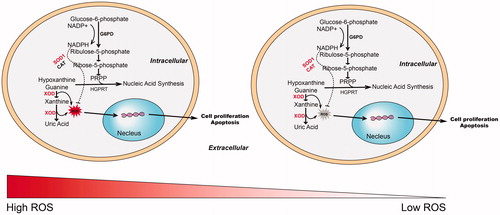
Figure 6. Overview of the differential metabolic phenotype and response to ouabain treatment in the two subtypes of DLBCL cell lines. NADP+: nicotinamide adenine dinucleotide phosphate; NADPH: reduced nicotinamide adenine dinucleotide phosphate; G6PD: glucose-6-phosphate dehydrogenase; XOD: xanthine oxidase; ROS: reactive oxygen species; PRPP: phosphoribosyl pyrophosphate; HGPRT: hypoxanthine-guanine phosphoribosyltransferase. SOD1: superoxide dismutase 1; CAT: catalase.